Creating a Report
User Clicks on Create icon in SplashBI Excel Connect Ribbon to get the Available Domains list window.
Now user can Create a report by 3 ways in SplashBI Excel Connect. That is by selecting Domain or Creating a Table by writing SQL or selecting a CSV.
1) User is first directed to select the Domain to create a report in that domain.
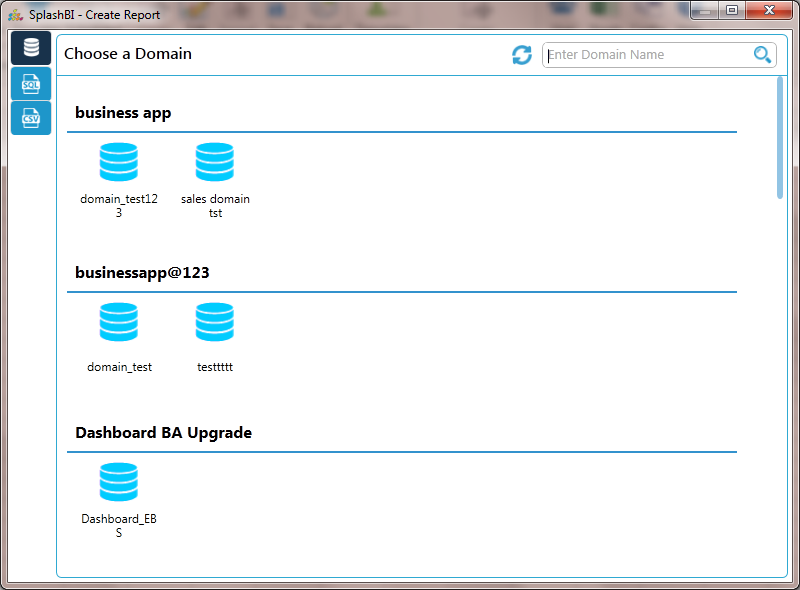
Domains List- Users can select which organization domain they want to pull portions of data from to populate the Report.
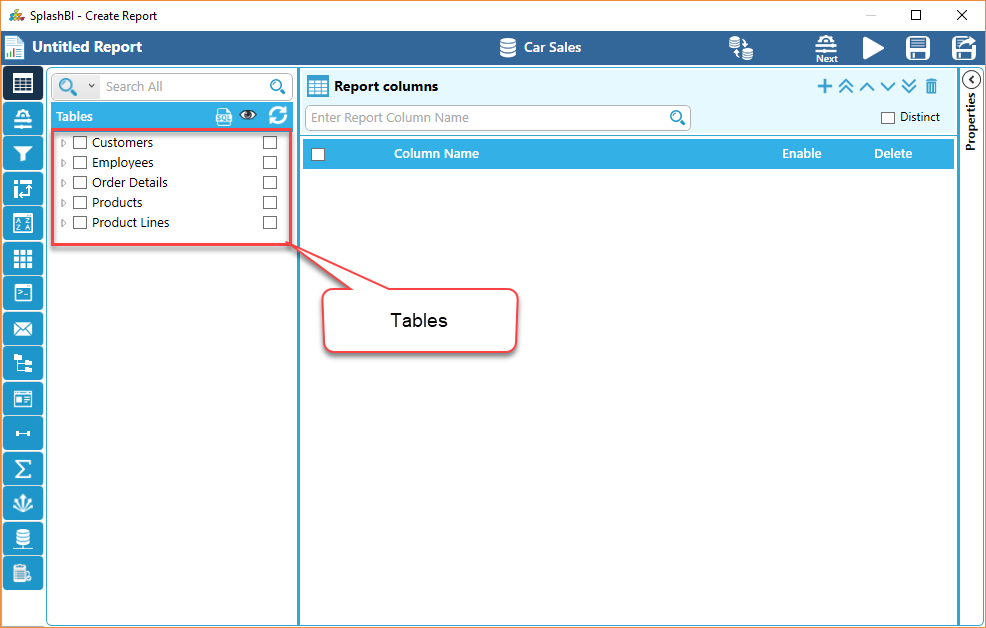
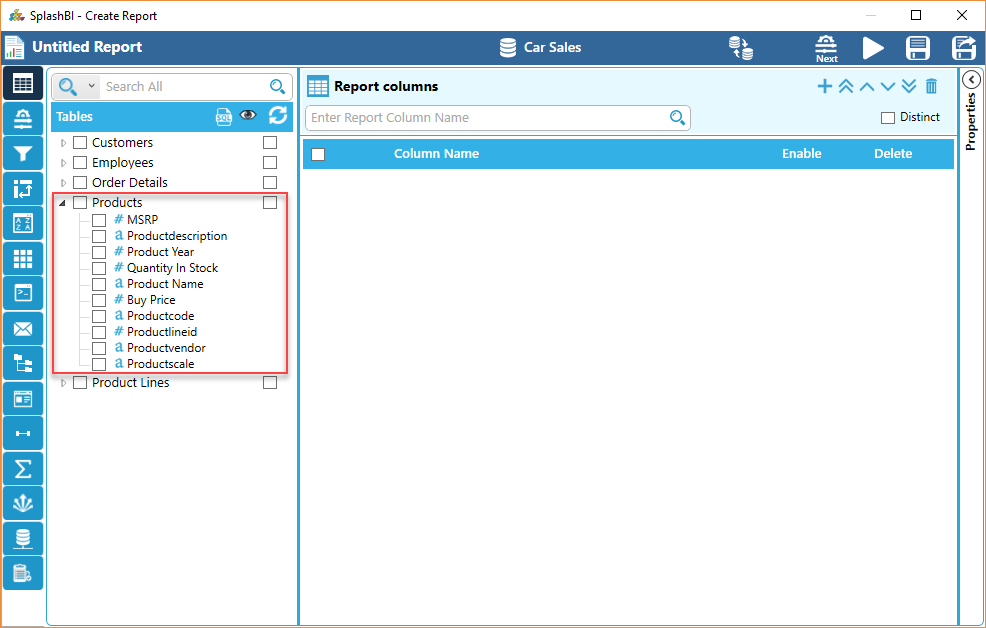
After selecting the domain, the user can find the tables of that domain.
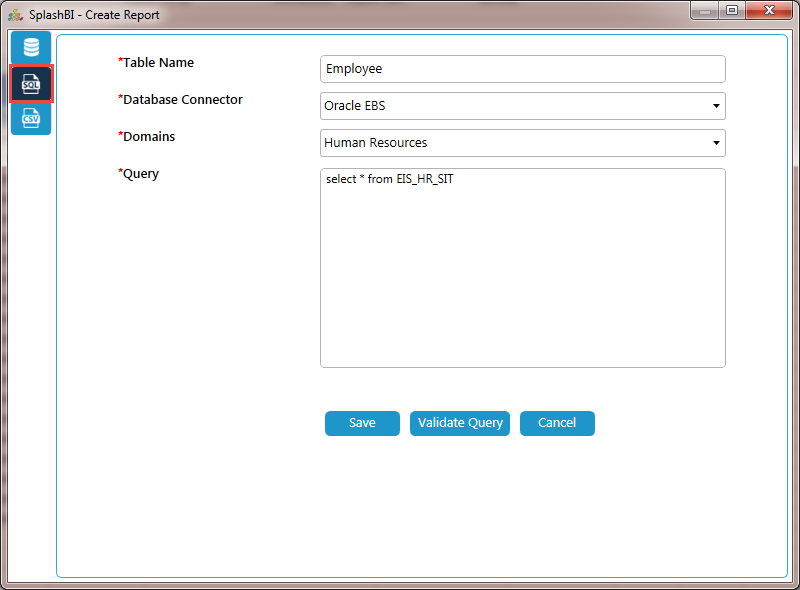
2) User can create a report by creating a table in particular connection and domain by writing SQL.
3) User can create a report by selecting a csv from computer or can give path of the csv.
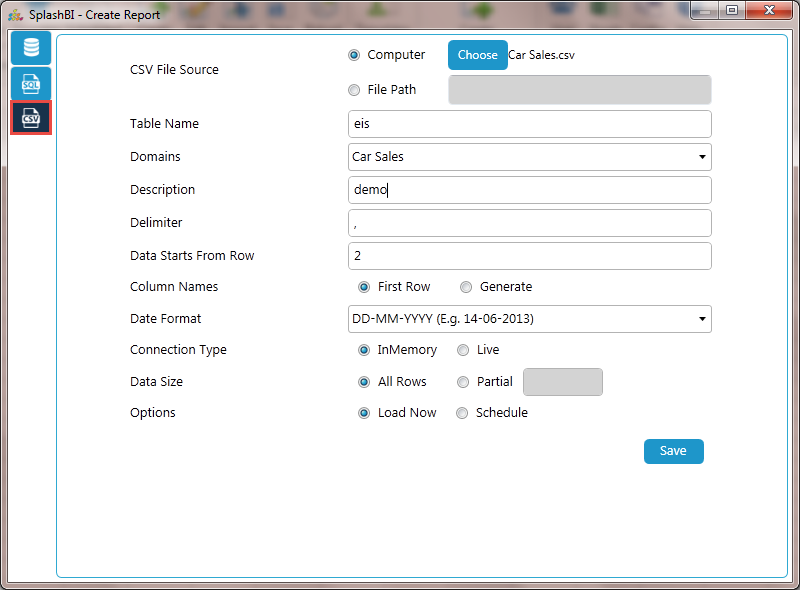
Provide the required details and click on save which will automatically redirects to the below screen where you can see the created table.
Navigation Icons
 Change Domain – Can change the domain by clicking on the change domain button of a new report.
 Previous - Takes the user to the previous item.
 Next - Takes the user to the next item.
 Save - Saves the report to the user's Report List.
 Save & Close – Saves the report to the user's Report List and Close the screen.
Progress Icons- These icons show each portion of Creating & Editing report that can be customized. Completing a section and clicking the 'Next' or 'Previous' icon will take the user forwards or backwards through each section. The icon that is a green shade than the other icons indicates which section the user is currently editing. To proceed to the next step in creating a report, continue reading.
 Filters Criteria- to learn more on this topic, click here
 Report Filters- to learn more on this topic, click here
 Report Pivots- to learn more on this topic, click here
 Report Sorts- to learn more on this topic, click here
 Report Grouping- to learn more on this topic, click here
 Report Distribution- to learn more on this topic, click here
 Report Drilldown- to learn more on this topic, click here
 Report Template- to learn more on this topic, click here
 Portals- to learn more on this topic, click here
 Totals- to learn more on this topic, click here
 Bursting- to learn more on this topic, click here
 Data Source- to learn more on this topic, click here
 Report Details- to learn more on this topic, click here
Editing a Report
To edit the report, click the  'Edit' icon in SplashBI Excel Connect ribbon.
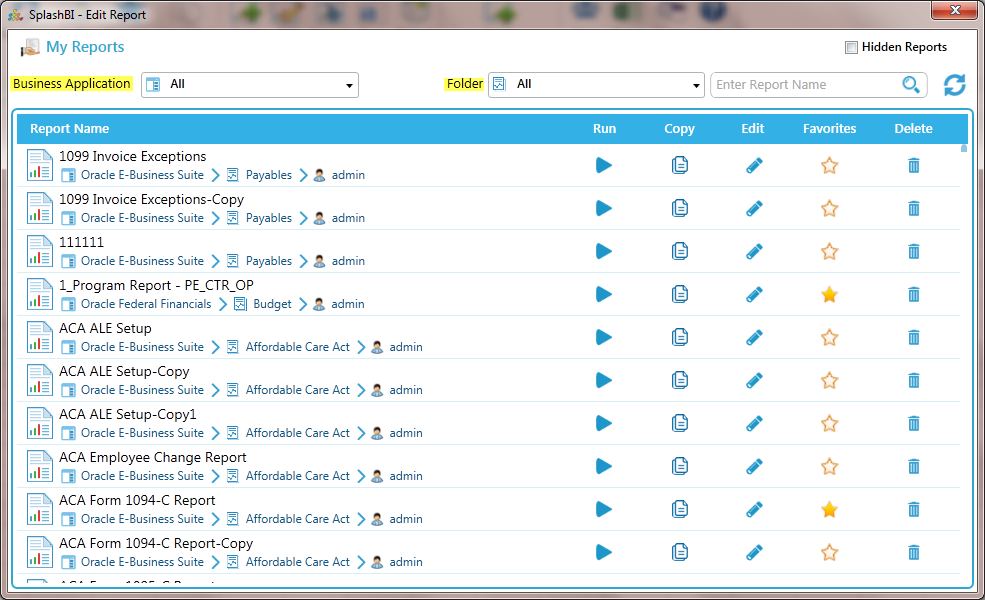
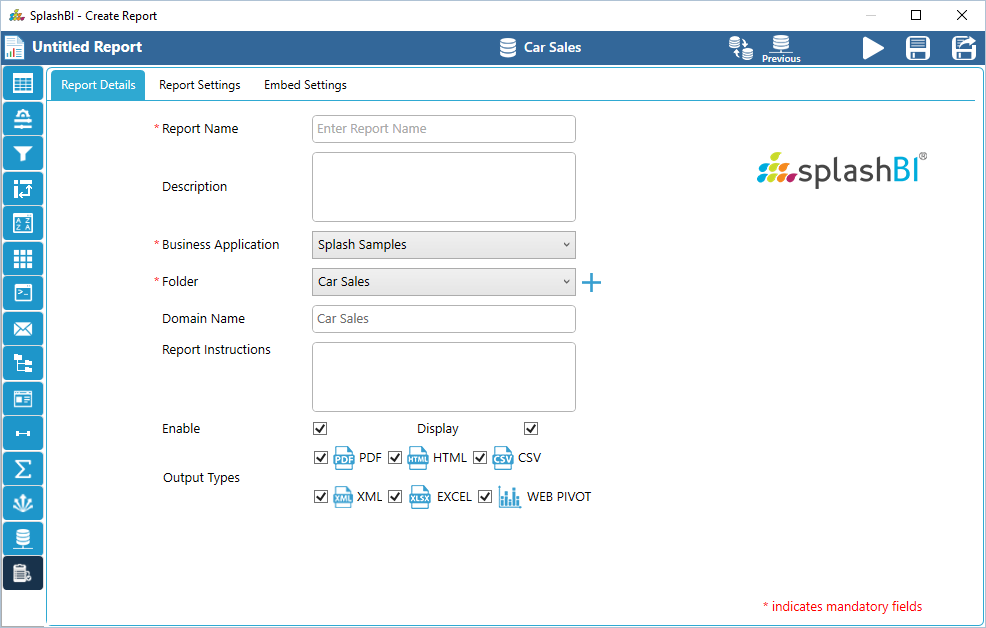
The edit function for reports allows the user to modify the details, such as Report Name, Assigned Business Application, Output types, and any applicable instructions. Fields denoted with an asterisk are required fields.
The report settings can also be changed by clicking on the report settings tab which can be seen in below screenshot.
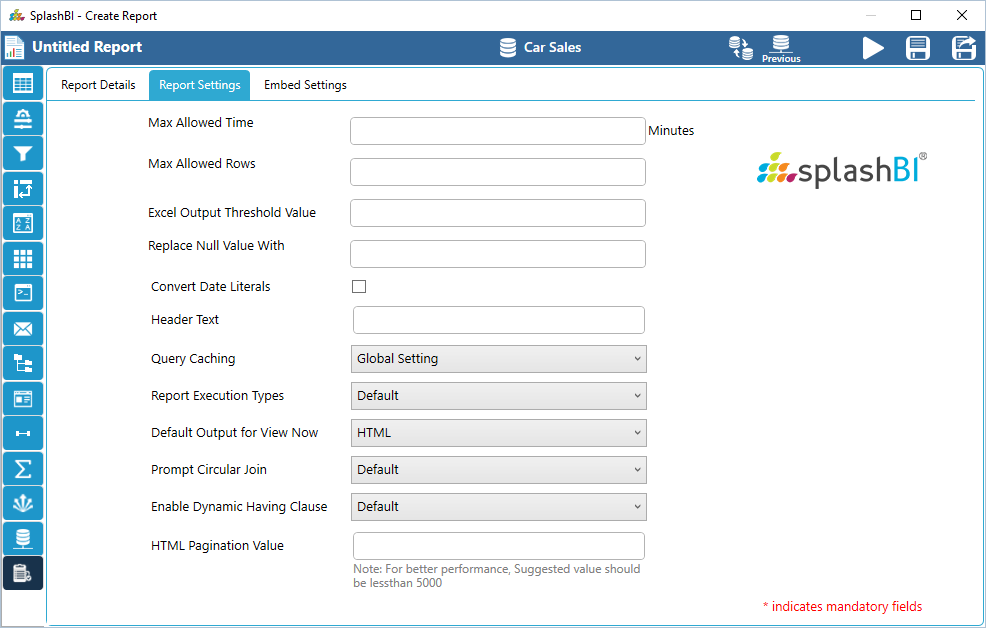
Replace Null Value With : This option allows the user to replace the null value in the report data with some value given here.
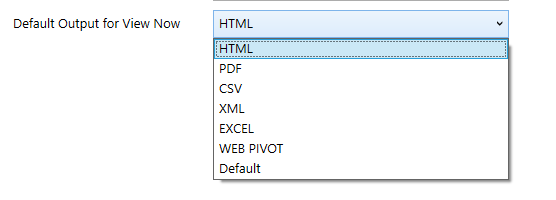
Default Output for View Now : This option allows the user to set the default output type to show while clicking on "view now" option when submitting the report.
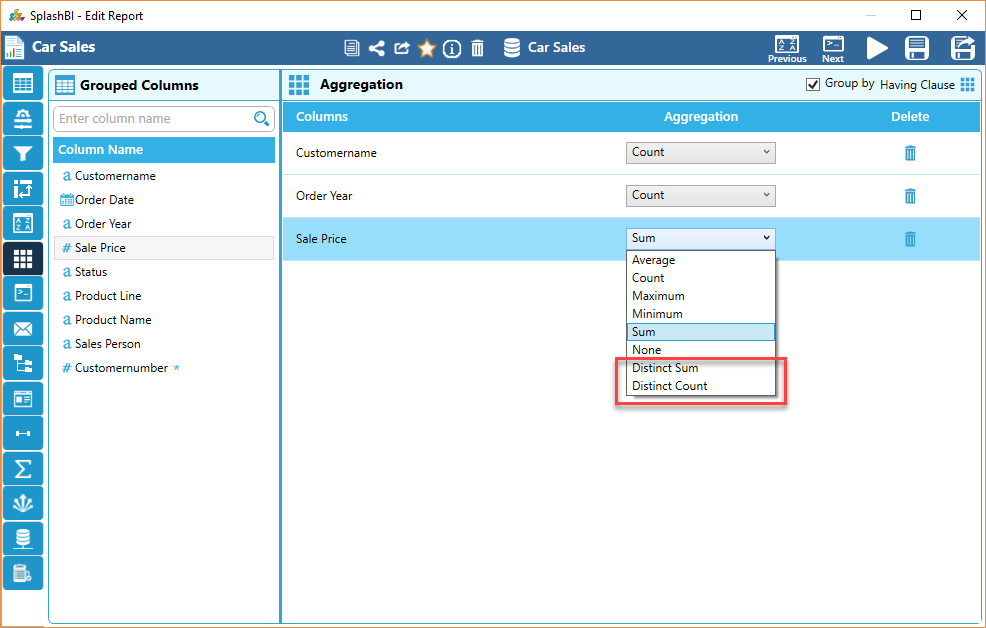
Distinct Sum & Distinct Count options in Aggregation :
When finished, click the 'Save' icon.