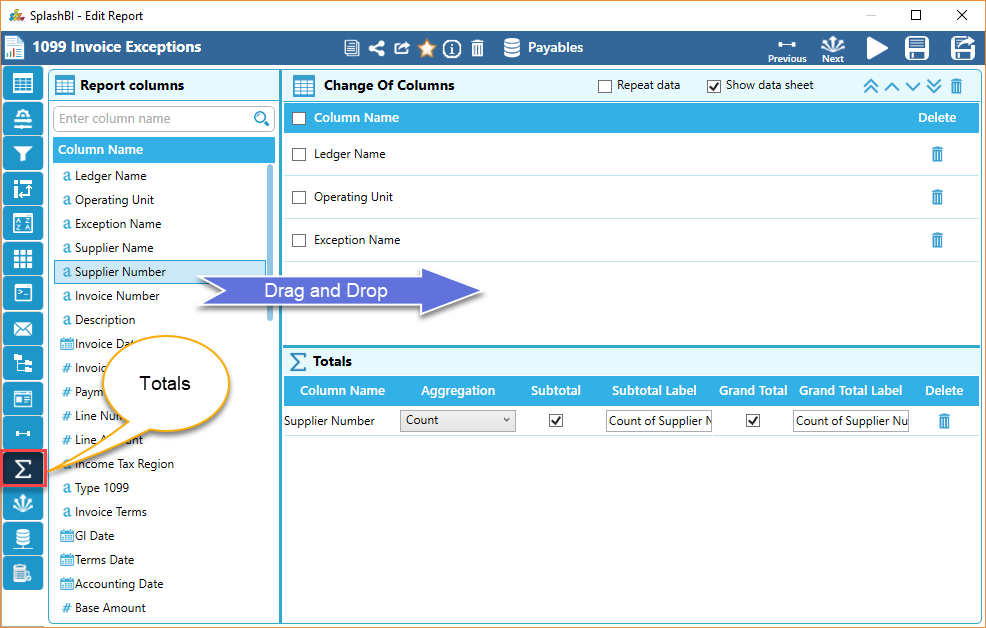
Totals tab is useful to show sub totals/aggregations on report columns in excel output data sheet rather than grouping the data in Pivot Excel output. "Totals" sheet will be displayed in Excel output where sub totals/aggregations are displayed as part of the data itself.
Repeat Data
When "Repeat Data" check box is checked then column data will be repeated in excel output totals sheet.
Show Data Sheet
Data sheet will be displayed in the excel output when "Show Data Sheet" check box is checked.
Change of Columns :
Change of Columns
It will displays all report column names in Change of Column dropdown.
Delete
By Clicking on delete icon the entire row is deleted.
Aggregations :
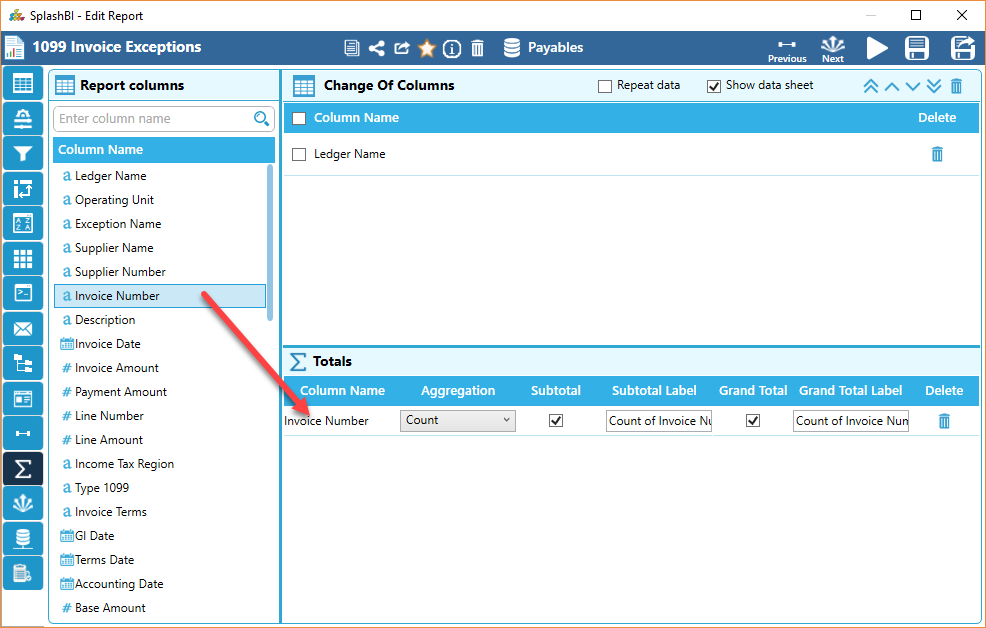
Column Name
It displays all report column names in user column name dropdown.
Aggregation
Choose appropriate aggregation type from aggregation drop down to perform aggregation operation on selected columns, aggregation types will be shown based on the data type of the selected column.
Sub Total
When this check box is checked then the sub total label will be displayed in the totals sheet.
Subtotal Label
User can enter the label name to show subtotals.
Grand Total
When this check box is checked then the grand total label will be displayed in the totals sheet.
Grand Total Label
User can enter the label name to show Grand totals.
Delete
Click on delete icon Delete to delete the entire row.
Save
Click on the Save button to save the changes.
To continue with the tutorial, click here