SplashBI Excel Connect Reports organizes all the information into alphanumeric order by report name. SplashBI Excel Connect reports can be found in a view of Reports tab.
SplashBI provides various options for creating and running reports which can be performed by the end user. The list of the reports owned by the end user(s) or shared will be listed in the all reports screen.
Business Application
Business Application can be created by the administrator of the SplashBI reporting tool which can be viewed in the SplashBI Excel Connect.
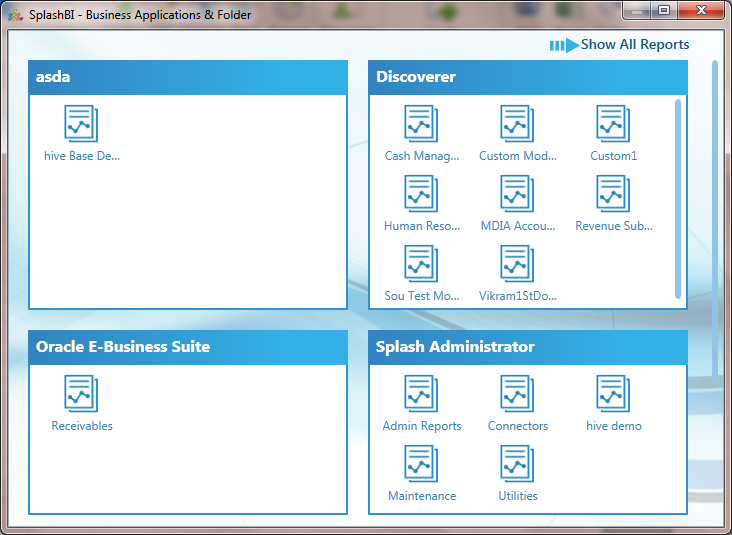
Report Groups
Report Groups are created by the Administrator of the SplashBI reporting tool. Report groups are similar to different functional areas of the organization, e.g. Accounts Payable, HR, General Ledger, etc.
Reports List View
Users can also run reports in the SplashBI Excel Connect Run window.The reports are displayed in alphanumeric order and shows additional buttons all from one screen.
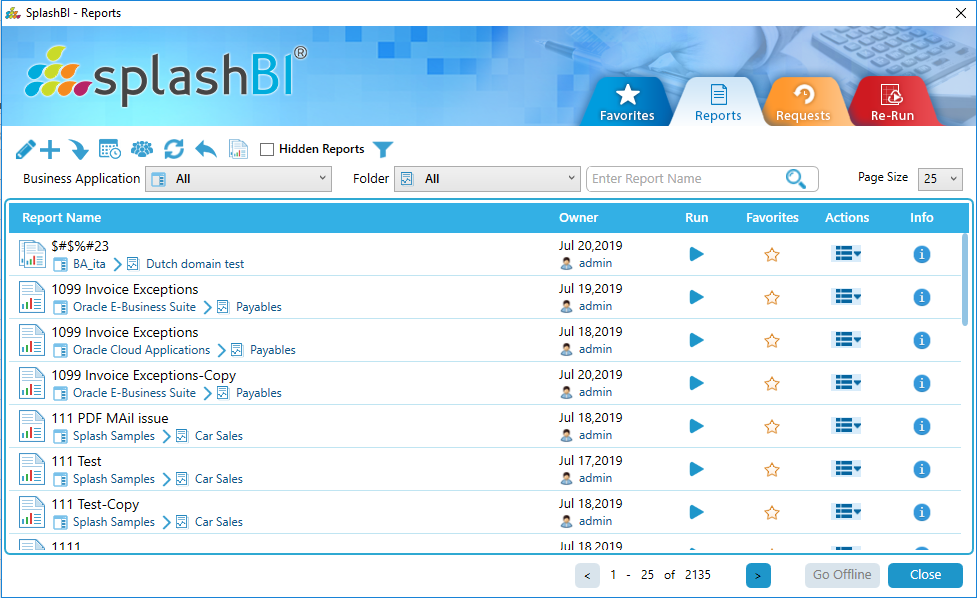
Report Options
 Mass Edit-
SplashBI Excel Connect provides a mass edit option for exporting
Mass Edit-
SplashBI Excel Connect provides a mass edit option for exporting
 and sharing
 reports for easy migration between instances. By clicking this icon, three additional icons will populate. Those icons are listed below:
1) Unshare Report- User can
unshare the multiple reports at a time.
Unshare Report- User can
unshare the multiple reports at a time.
2)  Changed to- User can change the multiple reports name , business
application and group at a time.
Changed to- User can change the multiple reports name , business
application and group at a time.
3)  Delete
Reports- User can
delete the multiple reports at a time.
Delete
Reports- User can
delete the multiple reports at a time.
 Create Report
-
This button redirects to the Create Report screen , where user can create the report.
Create Report
-
This button redirects to the Create Report screen , where user can create the report.
 Import Report -
This button redirects to the Import Report screen , where user can import the report.
Import Report -
This button redirects to the Import Report screen , where user can import the report. Scheduled Requests -
This button redirects to the Scheduled Requests screen in where user can edit , delete and check the scheduled requests.
Scheduled Requests -
This button redirects to the Scheduled Requests screen in where user can edit , delete and check the scheduled requests. User Groups -
This button redirects to the User Groups screen
User Groups -
This button redirects to the User Groups screen
 Refresh Reports -
This button refreshes the Reports.
Refresh Reports -
This button refreshes the Reports. Business Applications & Groups-
This button redirects to the business applications & groups
Business Applications & Groups-
This button redirects to the business applications & groups  Terminate -
This button is enabled when report is submitted.It is used to the terminate report ,when the report is in pending and processing.
Terminate -
This button is enabled when report is submitted.It is used to the terminate report ,when the report is in pending and processing. Hidden Reports -
This button is used to show hidden reports when enabled.
Hidden Reports -
This button is used to show hidden reports when enabled. Report Sets -
This button redirects to the report sets screen
Report Sets -
This button redirects to the report sets screen
 Filters -
Click the filter icon to view Reports and Report Sets selection options. Checking Reports will only displays reports, while checking Report Sets will only displays the Report Sets. By not checking any of them will display a blank page
Filters -
Click the filter icon to view Reports and Report Sets selection options. Checking Reports will only displays reports, while checking Report Sets will only displays the Report Sets. By not checking any of them will display a blank page