Modify Report button is available in run window from Reports tab, We can modify the report before submitting the report.
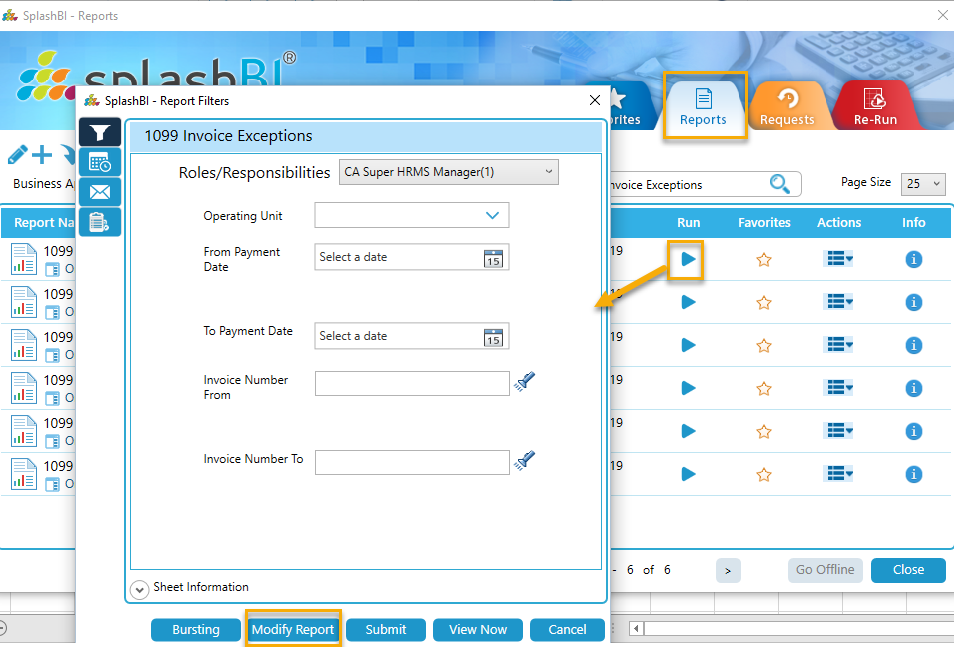
After Clicking on Modify Report button , A new window will open to modify the Report which can be seen in the below screen.
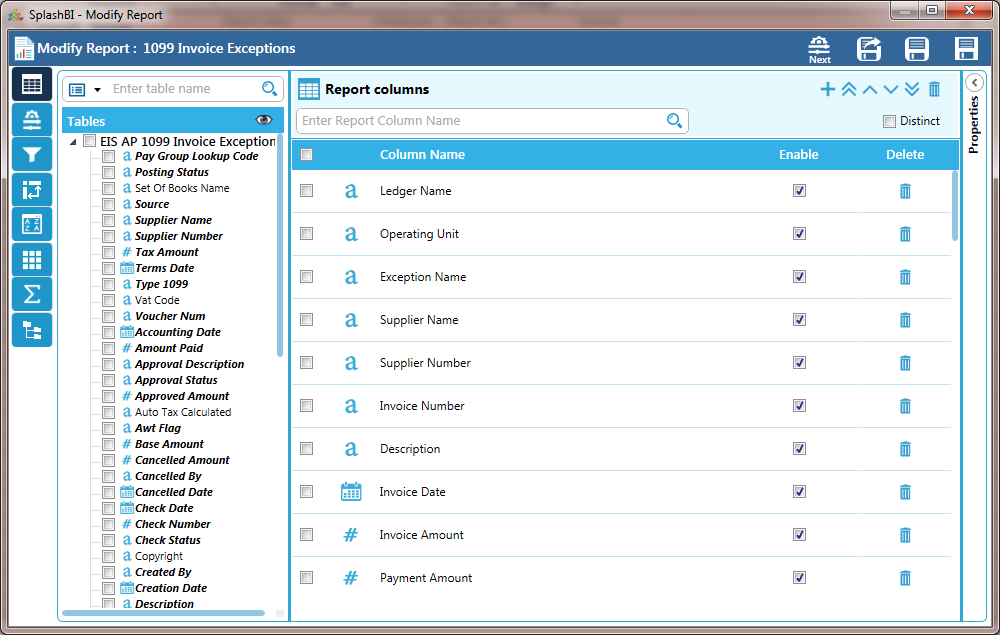
In this page user can either add/delete/update report columns/Filter Criteria/Filtering/Pivots/Sort/Aggregations/Totals.
Report Columns:
To add columns to the report, the user can either drag & drop into the Report Columns pane, or by double clicking on the report column.
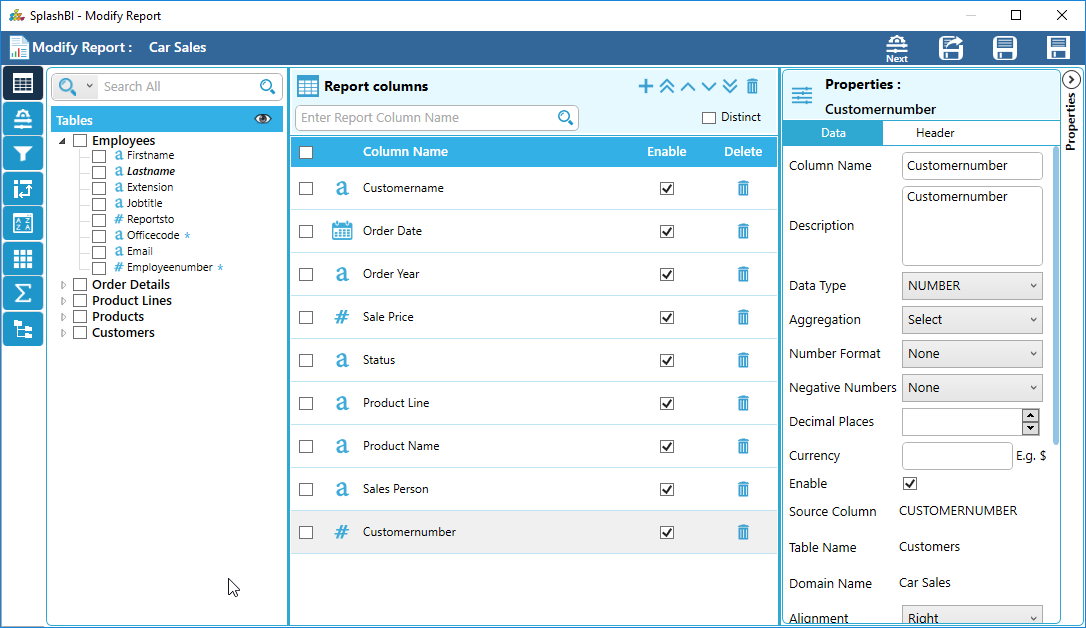
 'Add Calculation Column' icon, the user can now create custom calculations that will be built into the report.
 'Formula'
icon to enter the function of the formula. A pop up window will be prompted,
allowing the user to write out the formula with a variety of pre-programmed
operators.
'Formula'
icon to enter the function of the formula. A pop up window will be prompted,
allowing the user to write out the formula with a variety of pre-programmed
operators.Replace Null Value With : This option allows the user to replace the null value in the report data with some value given here of that particular report column.
Exclude In Select : If we check the exclude in select of particular column , that column is not visible in the report data.
Report Filters:
In the Report Filters screen, the user will have the ability to build filters based on selected Columns or by clicking the plus button. The Report Columns that the user choose on the previous menu will be visible in the Report Filters screen.
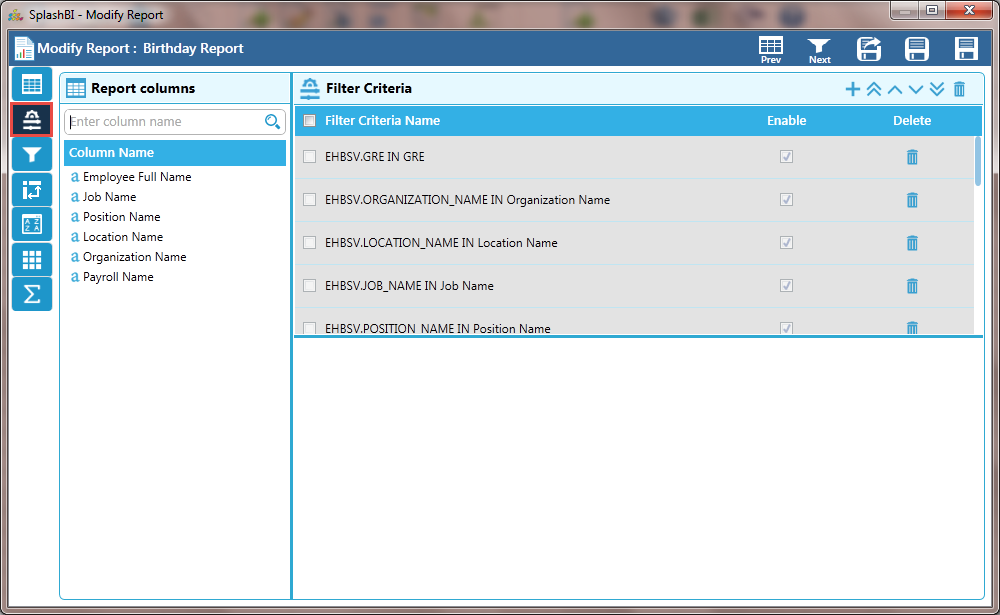
Click the 'Add Row'  icon to new filter condition.
Normal
By default, the add type is normal. Click on the  icon to modify Item, Value1 and Value2 and to enter a formula by dragging and dropping Report Columns, Report Filters or Available Columns.
Click on the  icon to choose values for Value1 and Value2.
Free Text
Add conditions in the text box provided. Click the  icon to enter formula by dragging and dropping Report Columns, Report filters or Available Columns.
Once the filter criteria are built correctly for the Report, click the ![]() 'Next'
icon to proceed to the Filters section.
'Next'
icon to proceed to the Filters section.
Report Filters:
Here, the user can drag & drop report columns to create filters for those specific columns. Any filters the user enabled in the previous screen will be enabled as a filters when you arrive at the Report filters screen.
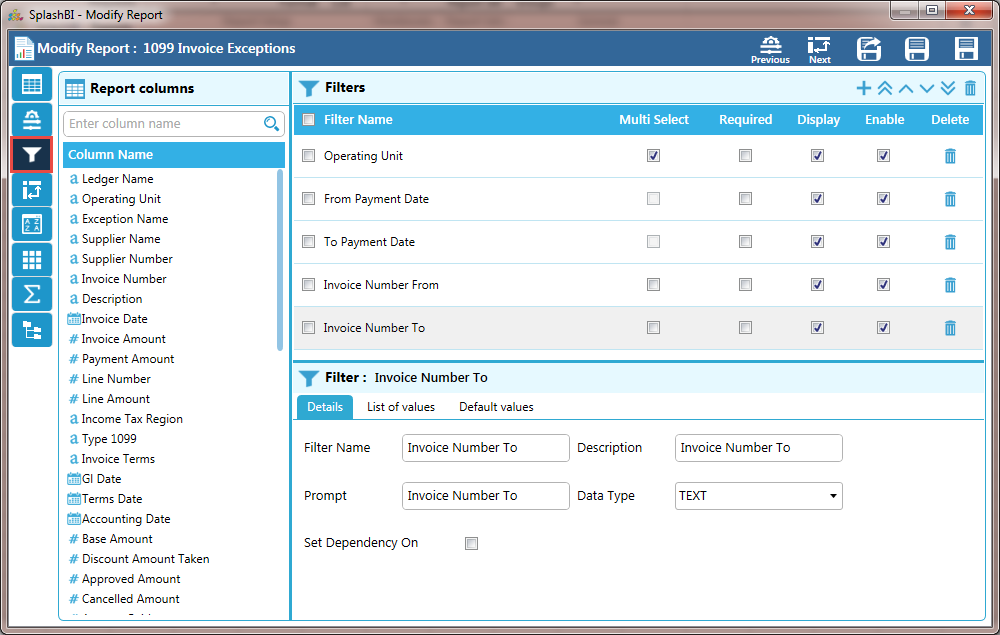
The user can click on the column to modify the filters and to customize the Report Filter. There are three tabs in this window, you can see the 'Details' tab in the above picture where the user can customize how the filter will be seen in the report. The user can also specify the List of Values source under the 'List of Values' tab, and adjust the Value Type under the 'Default Values' tab.
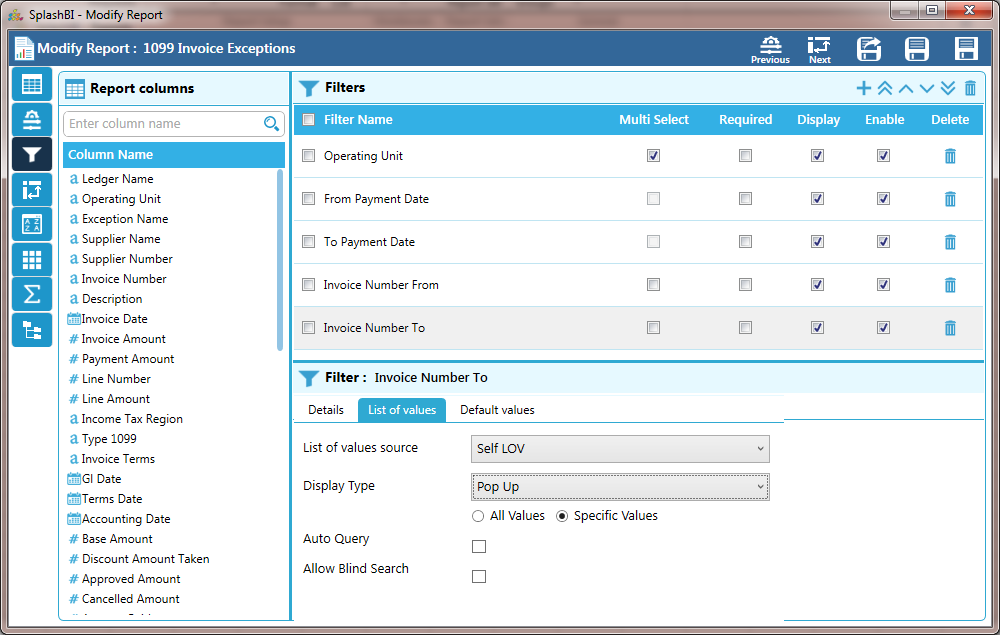
List of Values
The user can select to use either all List of Values associated with the report, or choose specific values and the user can give filter Dependant column data so that the user selects some values and set for LOV.
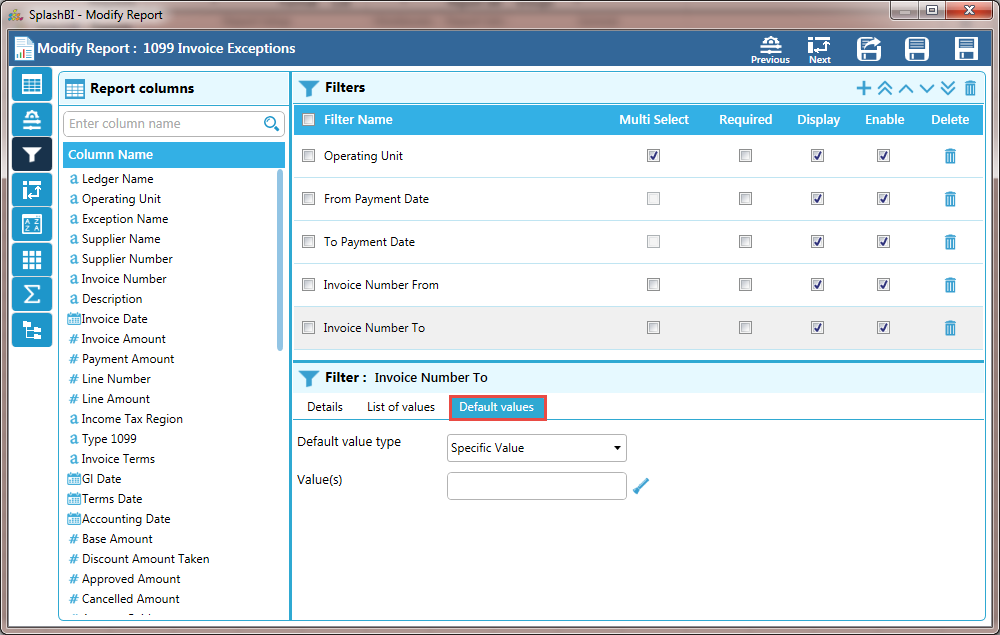
Default Values
Under the Default Values tab, the user can define the default value type of the report filter.
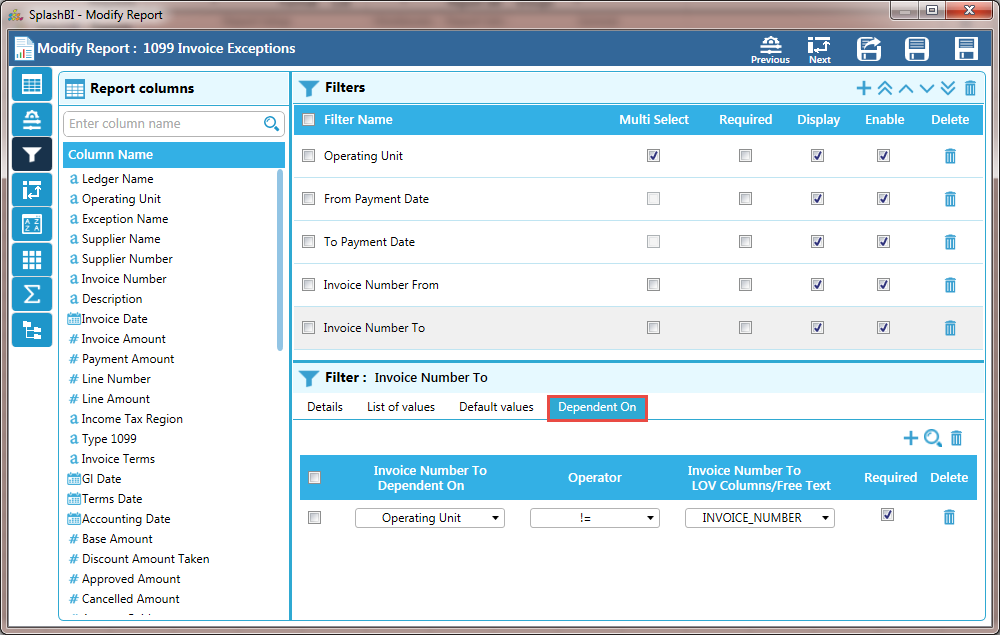
Dependent On
By selecting the 'Set Dependency On' in the Details tab, the user can define the dependency type of the report filter.
Report Pivots:
In this screen the user can modify /add the pivots
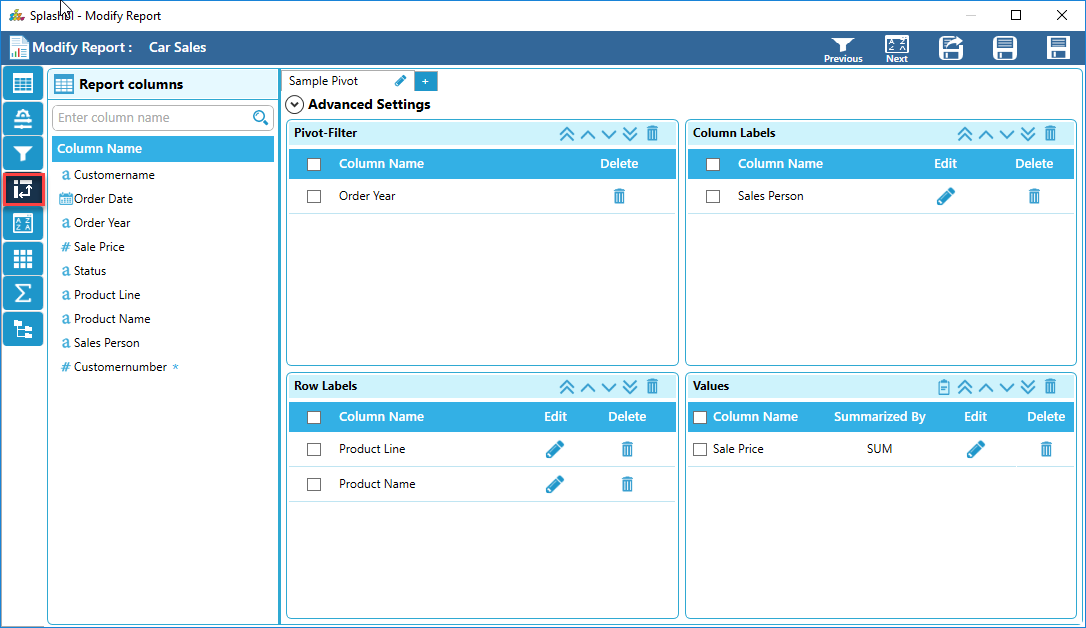
 icon which will be displayed beside the pivot name. The user can also reorder the values in all sections by using the 'Reorder'
  buttons presented in each section
 Icon
Icon
Icon
Icon
Advanced Settings:
SplashBI Excel Connect allows the user to
modify the advanced settings of a pivot by clicking on the 'Advanced Settings'  icon at the end of pivot tab, it expands the screen with pivot advanced settings details.
•Once Advanced Settings is clicked, the screen will expand appear to further customize the pivot table.
•Sub Totals can be changed to view at the top of the group, bottom of the group, or no sub totals , click the down arrow to display choices and choose by clicking desired method.
•The Report Layout can also be modified in the pivot table. Click the down arrow from the Report Layout to display choices.

• Grand totals can be modified for pivot table values by clicking the down arrow from this field.

• Within the pivot table, users can separate each group of row data by using the inserting method to separate each change. The user can click the down arrow from the Blank Rows field to insert a blank after each item or remove a blank after each column.

• For pivot table style options, users can have banned Rows, Banned Columns, Column Headers, or Row Headers.
• The field list is the column names of a data source and user can modify the pivot table by using the check mark choice next to the column name of information to bring in the pivot output or the drop and drag method. Click the down arrow from the field list box to reveal choices, select by clicking the desired sorting method.
•Within the excel pivot table options is a choice for table style. The table style ranges from dark to light with a variety of color intensity, this can be chosen from the creation of the pivot, or once the report has been downloaded into an excel output.
Click the down arrow from the Table Style field to reveal color intensity choices.

•Once all choices have been selected, click the arrow button![]() to exit from advanced settings.
to exit from advanced settings.
Once the user has finished the changes in Report Pivots, click 'Next' to proceed to the next screen.
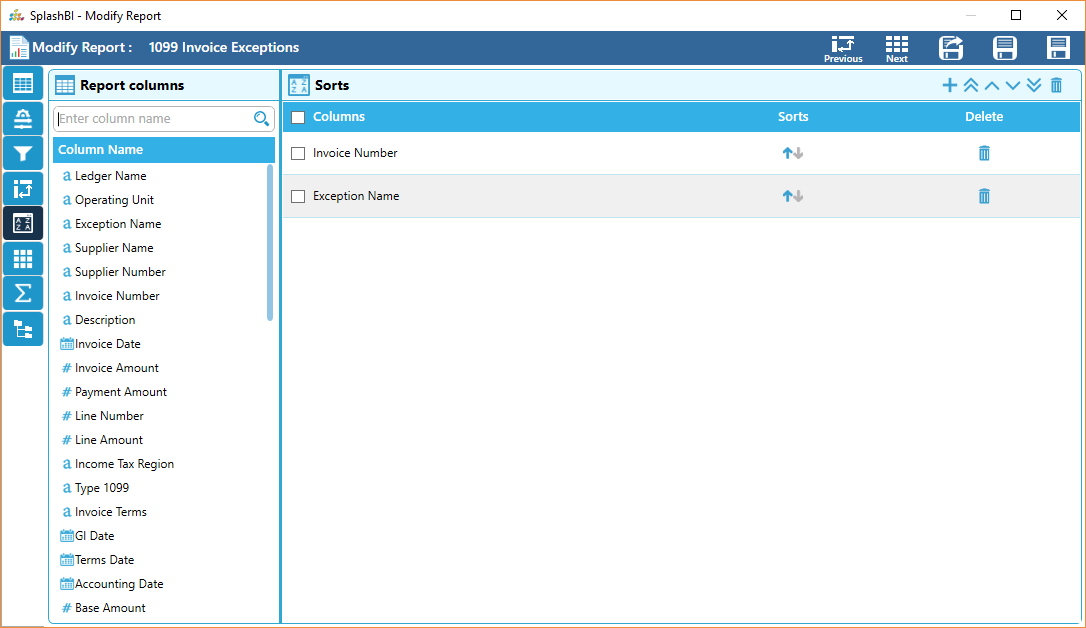
Report Sorts:
Here, the user can modify which report columns
will be preprogrammed with sort options in the report. By clicking the up or
down arrows sort for that column , the user can automatically set an
ascending or descending sort for
that column.
Report Aggregations:
The SplashBI Excel Connect allows users to modify the existing aggregations
applied to particular data of a report. Click the 'Aggregation' ![]() icon to begin.
icon to begin.
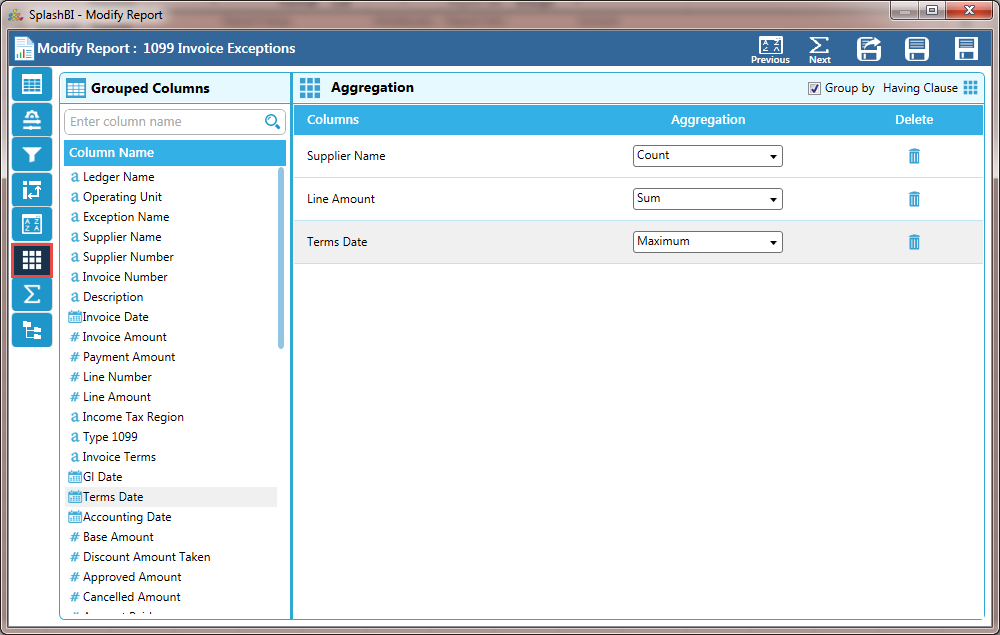
Group By in Aggregations
If we add any one column to aggregation then group by flag will be true(check box will be checked). If we delete all columns from aggregation then group by flag will be false(check box will be unchecked)
Report Totals:
Totals tab is useful to show sub totals/aggregations on report columns in excel output data sheet rather than grouping the data in Pivot Excel output. "Totals" sheet will be displayed in Excel output where sub totals/aggregations are displayed as part of the data itself.
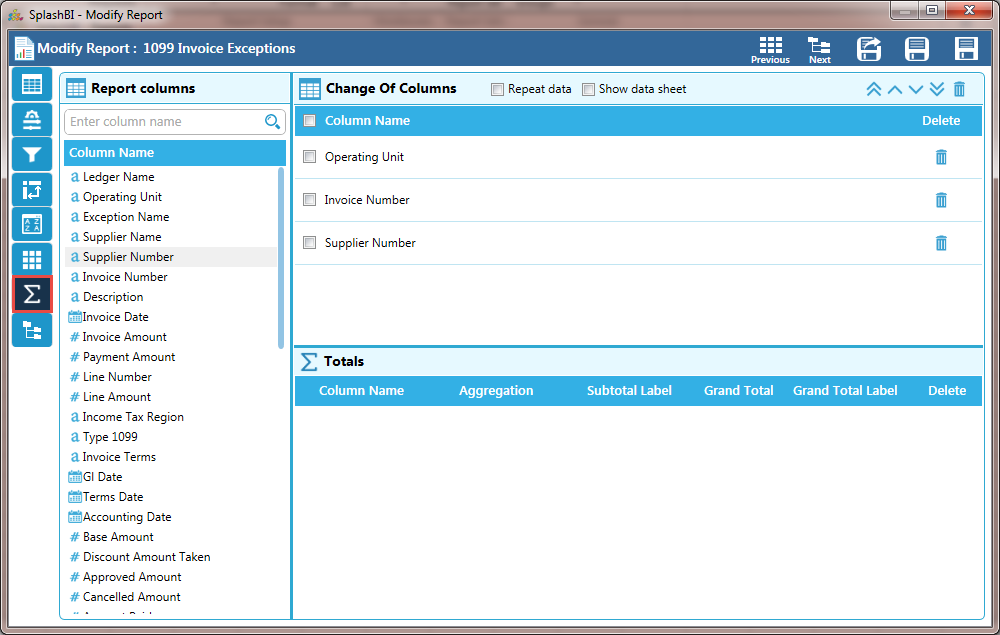
Repeat Data
When "Repeat Data" check box is checked then column data will be repeated in excel output totals sheet.
Show Data Sheet
Data sheet will be displayed in the excel output when "Show Data Sheet" check box is checked.
Change of Columns :
Change of Columns
It will displays all report column names in Change of Column dropdown.
Delete
By Clicking on delete icon the entire row is deleted.
Aggregations :

Column Name
It displays all report column names in user column name dropdown.
Aggregation
Choose appropriate aggregation type from aggregation drop down to perform aggregation operation on selected columns, aggregation types will be shown based on the data type of the selected column.
Sub Total
When this check box is checked then the sub total label will be displayed in the totals sheet.
Subtotal Label
User can enter the label name to show subtotals.
Grand Total
When this check box is checked then the grand total label will be displayed in the totals sheet.
Grand Total Label
User can enter the label name to show Grand totals.
Delete
Click on delete icon Delete to delete the entire row.
Save
Click on the Save button to save the changes.
Save & Close
The user can save the changes by clicking on the save & close button in all the screens.
SaveAs
The user can save the changes by clicking on the saveas button in all the screens which shows two options.They are Create as new report and modify the existing report.
Create as new report:
The option will create a new report with the changes done.
Modify the existing report:
The option will modify the existing report with the changes done.