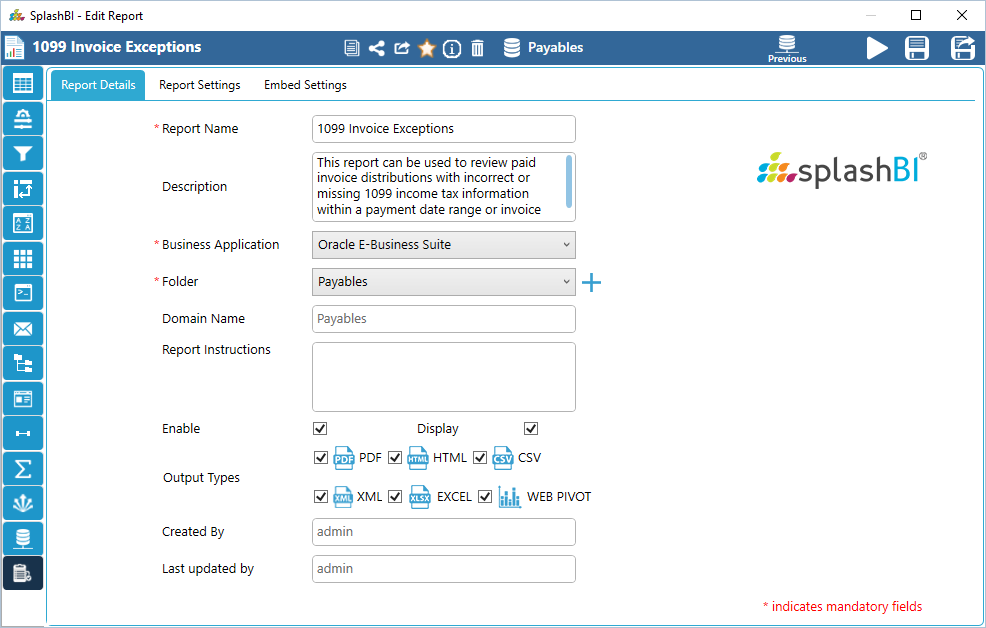
To edit the report, click the ![]() 'Edit' icon in SplashBI Excel Connect ribbon.
'Edit' icon in SplashBI Excel Connect ribbon.
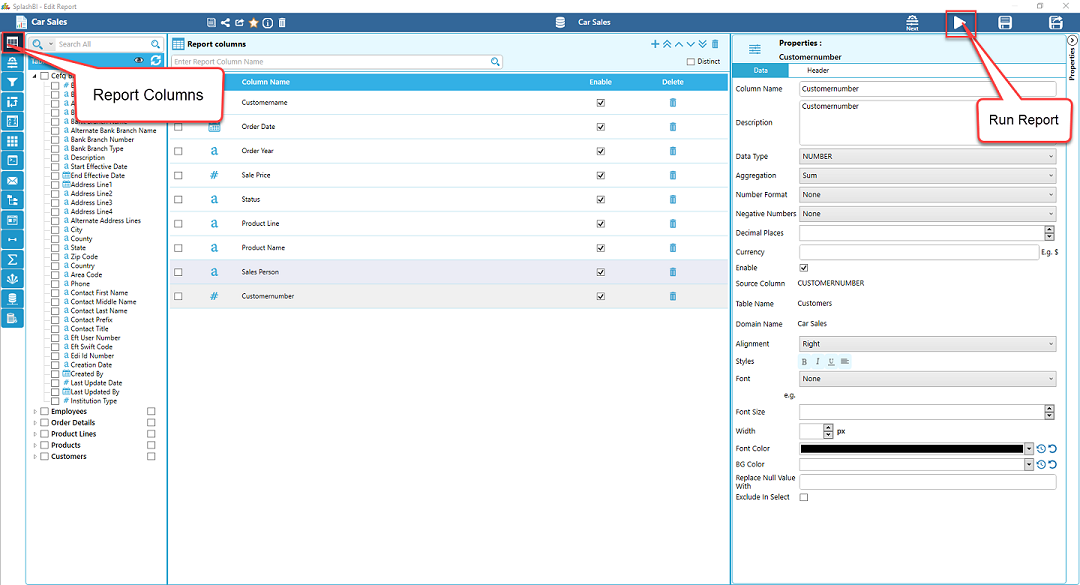
Report Columns:
The user can expand and minimize by clicking on to the table name to select the more or remove report columns . The columns of the report can edited by changing the properties of the columns desired.
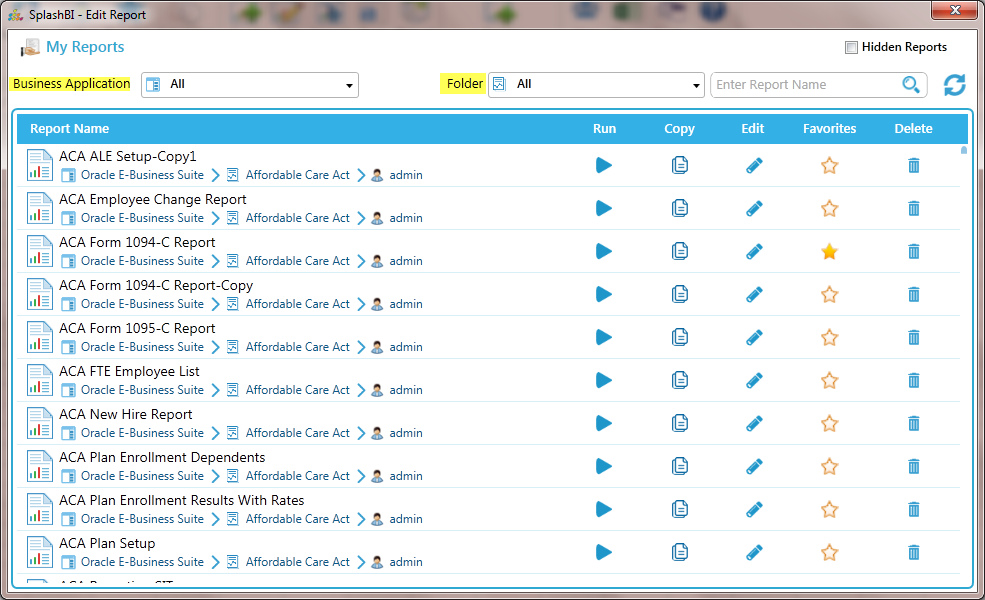
 Copy Report - The report can be copied by clicking on the copy button.
 Share Report - The report can be shared by clicking on the share button.
 Export Report - The report can be Export by clicking on the Export button
 Favorite Report-The report can be made favorite by clicking on the favorite button.
 Delete Report -The report can be deleted by clicking on the delete button.
 Help -Navigates to the tool help document.
By clicking on the next the tab is redirected to Report Filters.
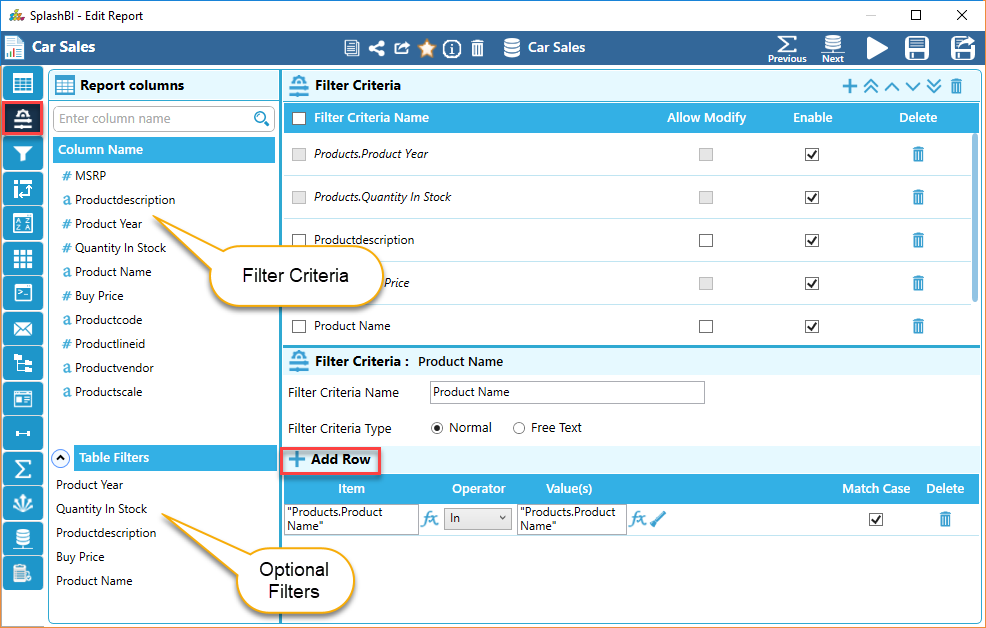
Filters Criteria
In the Filters
Criteria screen, the user will have the ability to build filters based on selected Columns. The Report Columns that the user choose on the previous menu will be visible in the Filters
Criteria screen.
By clicking on the next the tab is redirected to Report Filters.
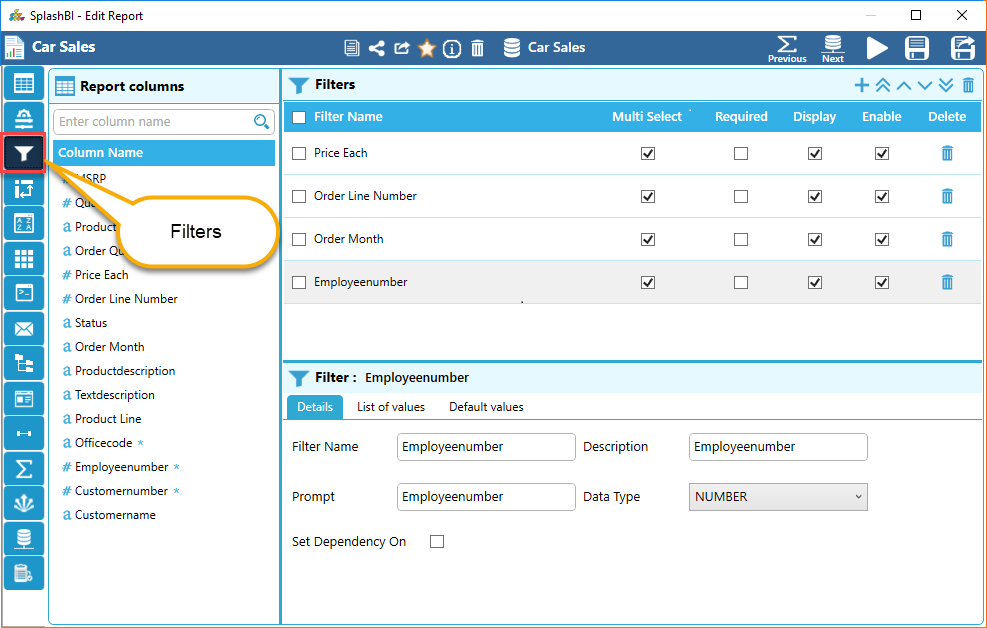
Report Filters
Any filter criteria the user enabled in the previous screen will be enabled as a filter when you arrive at the Report filters screen..
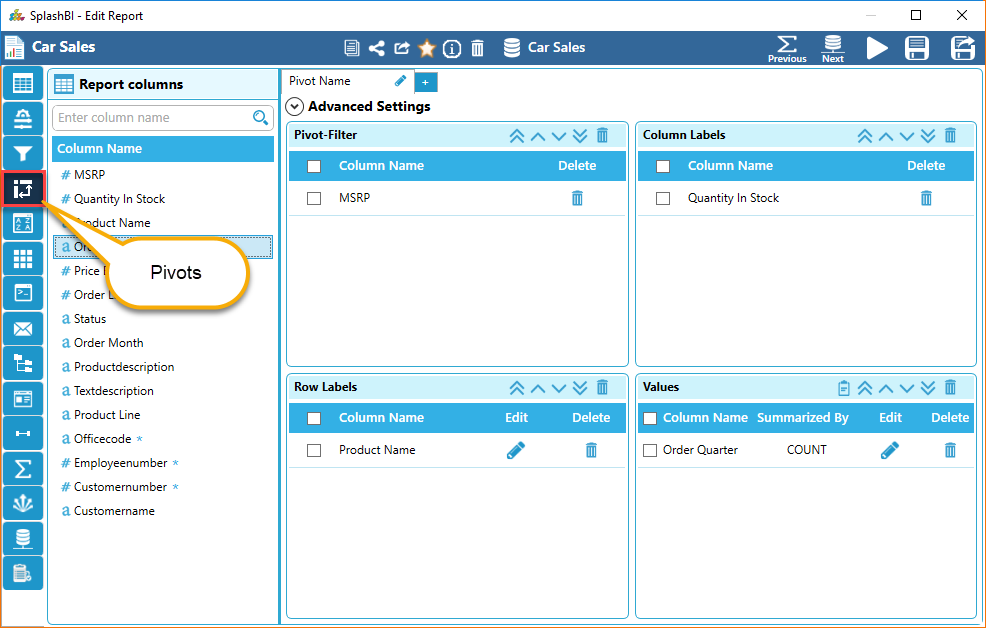
Report Pivots
Pivot tables are mainly used for a quick summarization and analysis of large amounts of data in lists and tables.The pivots the are created can be edited in this screen.
By clicking on the next tab the user is redirected to Report Sorts.
Report Sorts
Here, the user can find the Report Sort screen .
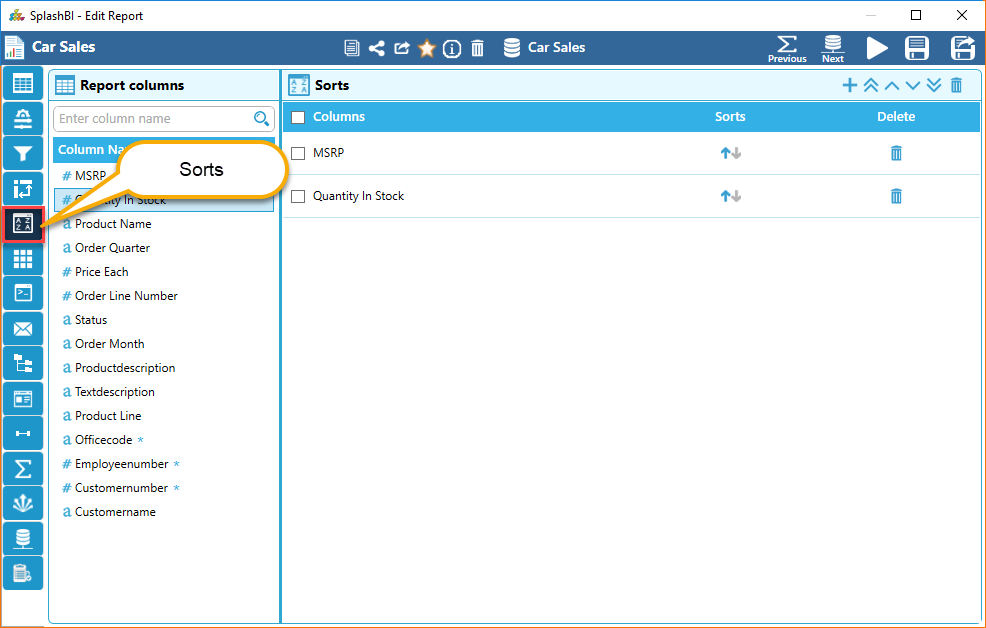
 , the user can automatically set an ascending or descending sort for that column.
By clicking on the next tab the user is redirected to Report aggregation tab.
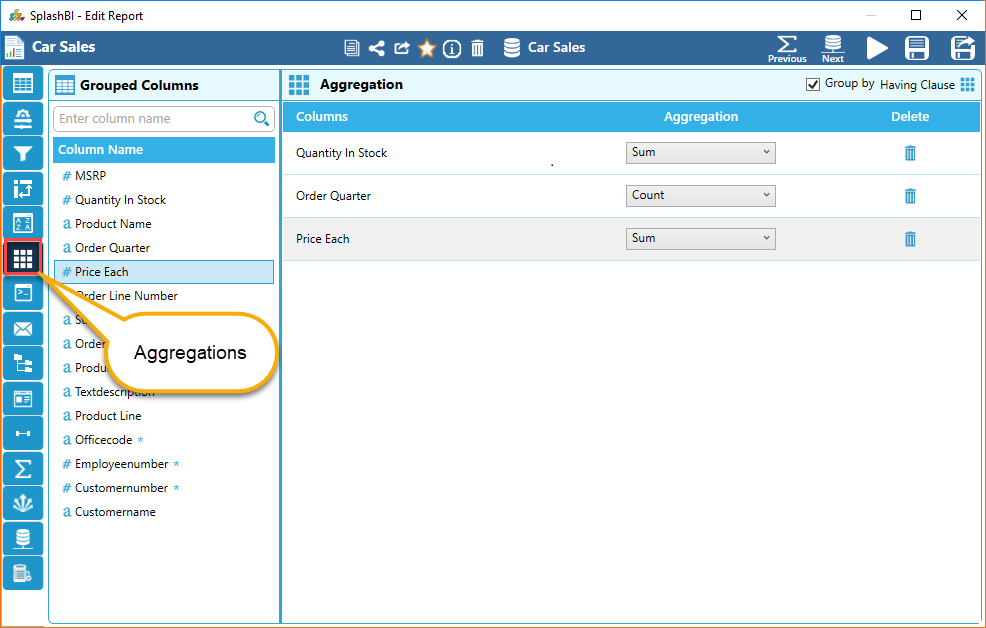
Report Aggregation
The user can find the below screen for report aggregation.
By clicking on the next tab the user is redirected to the Report triggers tab.
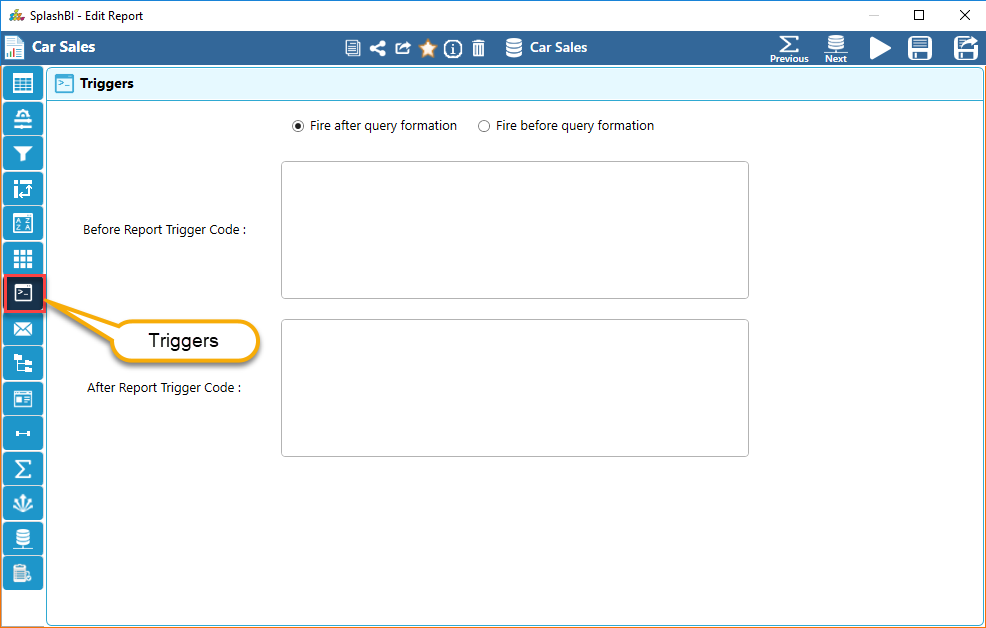
Report Triggers
The user can find the below screen for report triggers.
By clicking on the next tab the user is redirected to the Report Distribution tab.
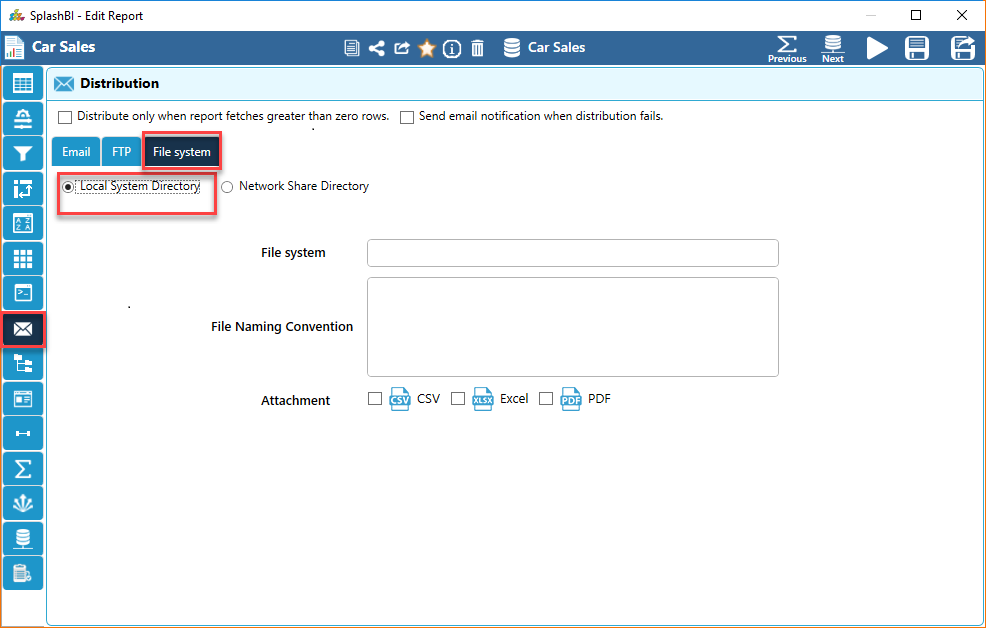
Report Distribution
The user can find the below screen for report distribution.
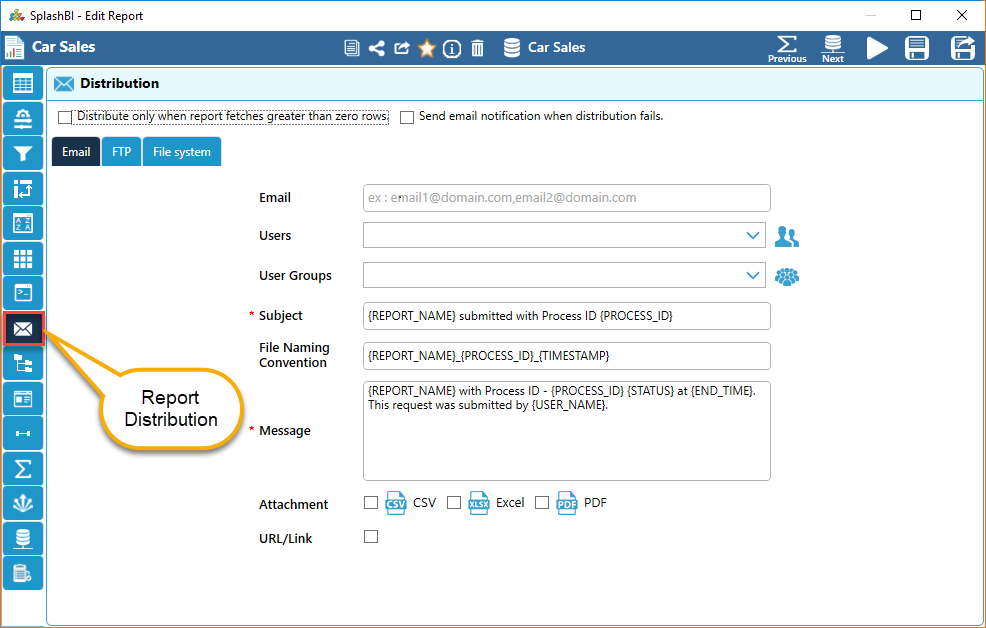
It will send an Email only when report contains greater than zero rows.

It will send an Email when distribuion fails.
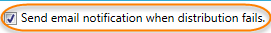
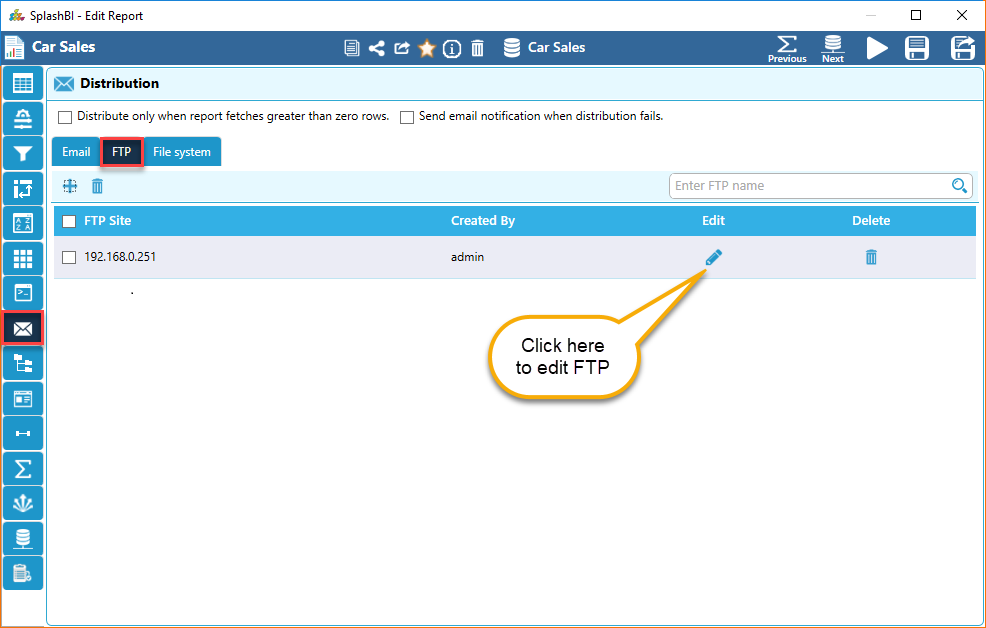
FTP
FTP Site can be edited where FTP Site name and other details on the screen can be changed and save it.
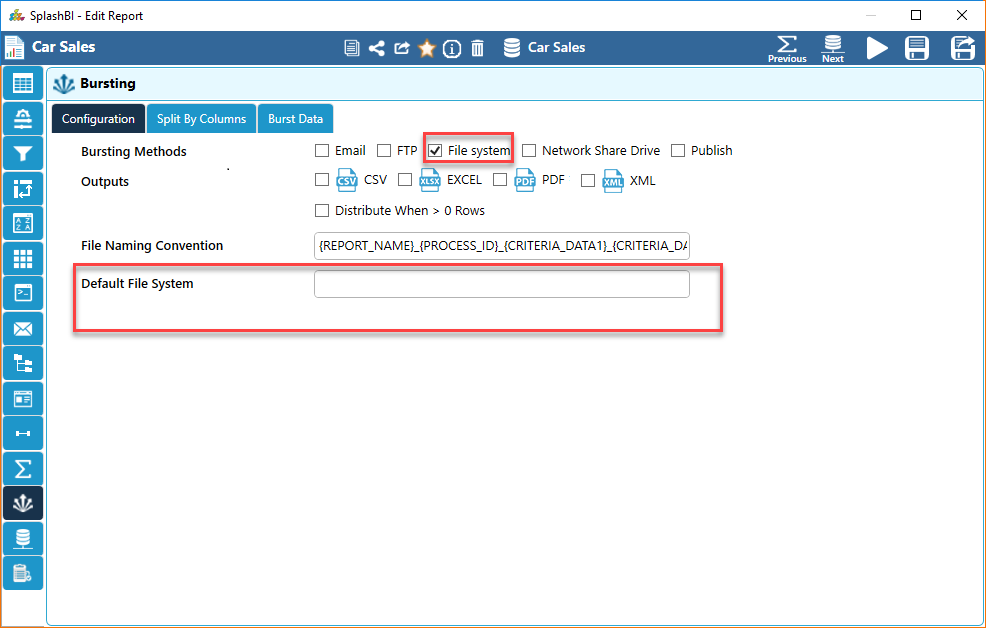
File System
File system refers to the different folder paths in a structural way in the server.
Local system Directory.
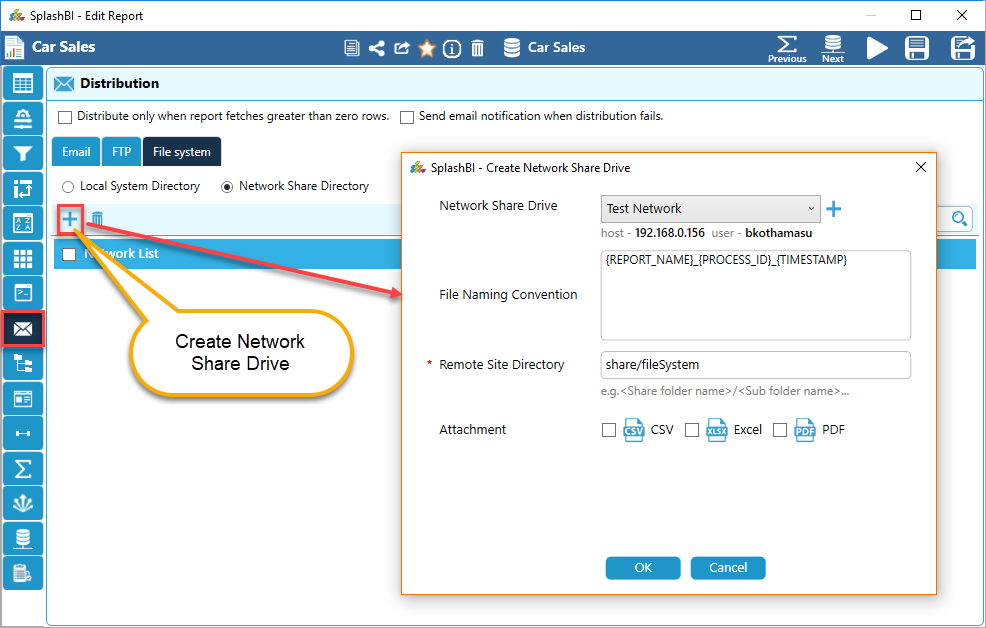
Creating Network Share Drive.
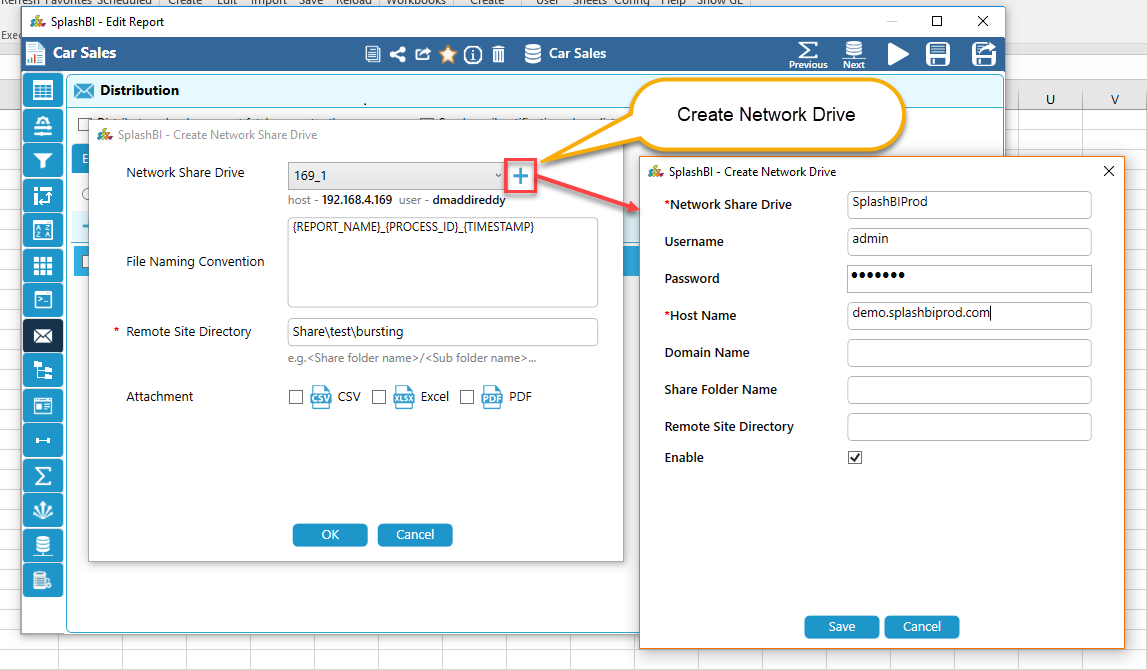
Creating Network Drive.
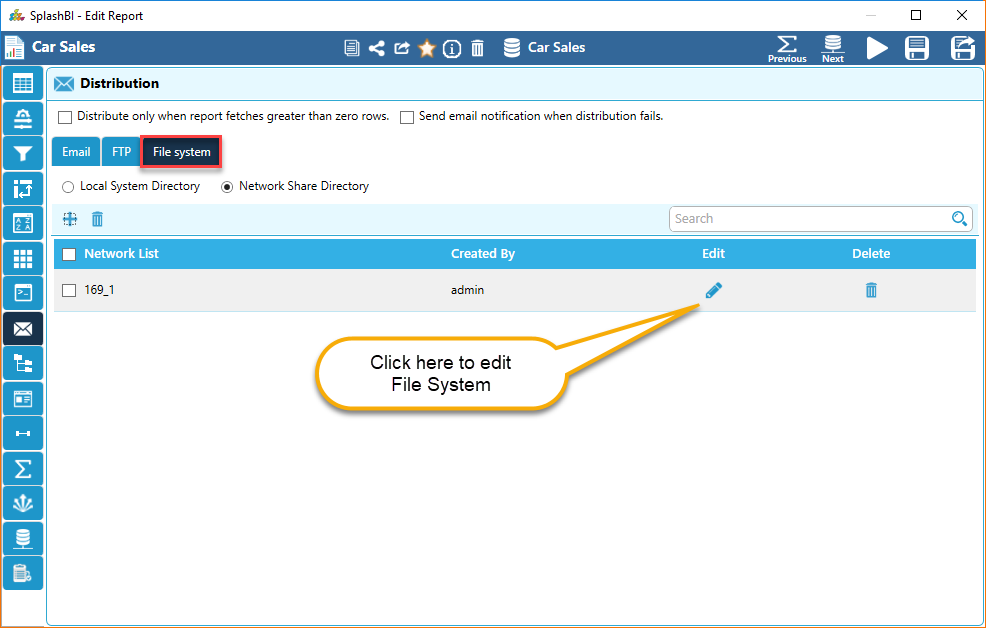
Edit Network Share Drive.
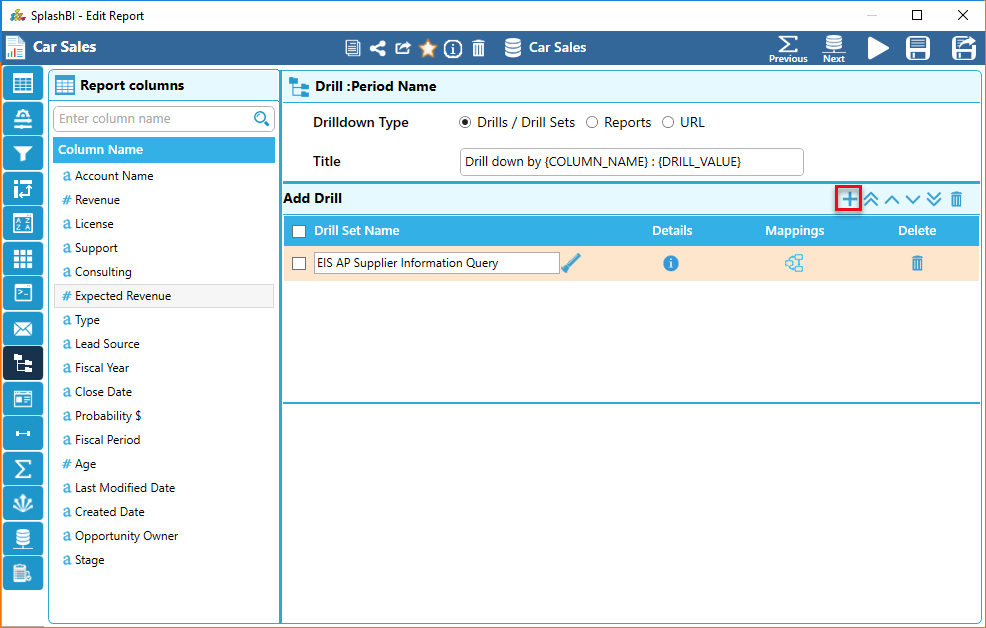
Report DrillDown
The user can find the below screen for report drilldown.
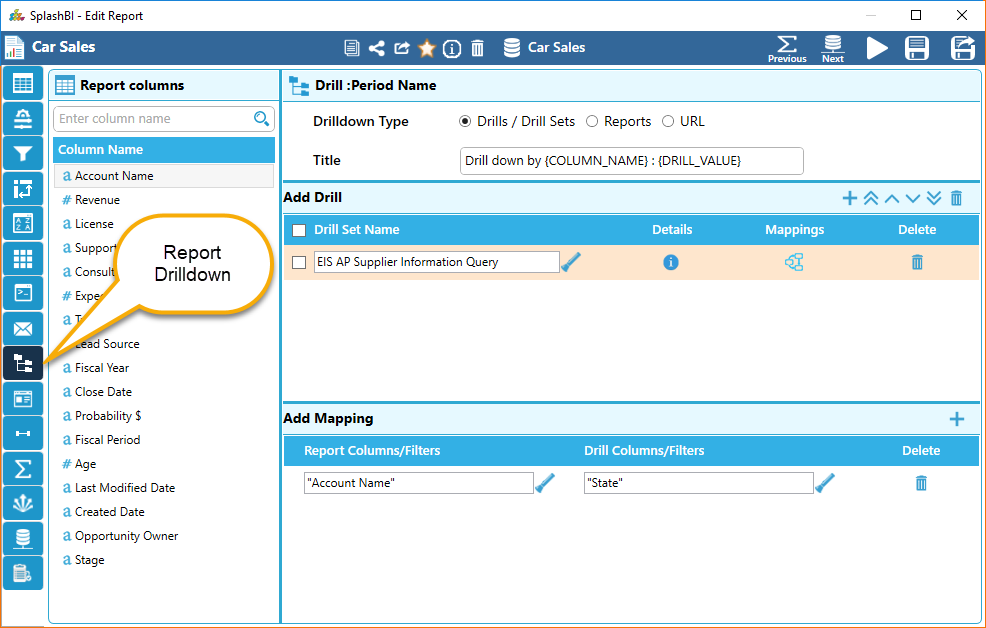
This drill down is designed to extract very specific information as part of the underlying data attached to the report.
Drills/Drill Sets Name
Here Drill set can be edited by editing drill set name ,mapping or can add a new drill set
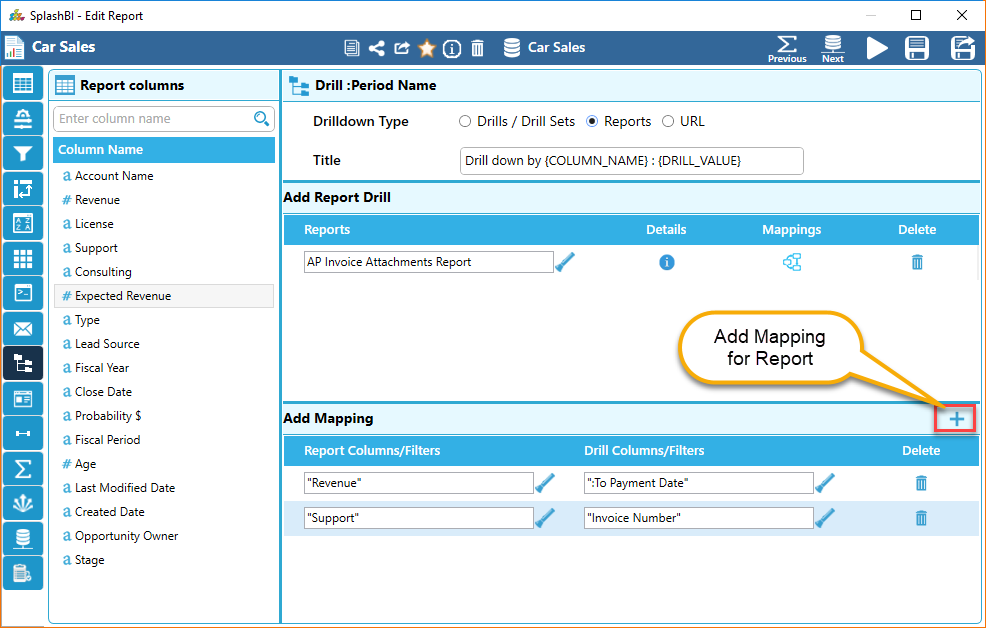
Reports DrillDown
Here Report DrillDown be edited by changing report name or by adding other map to that report.
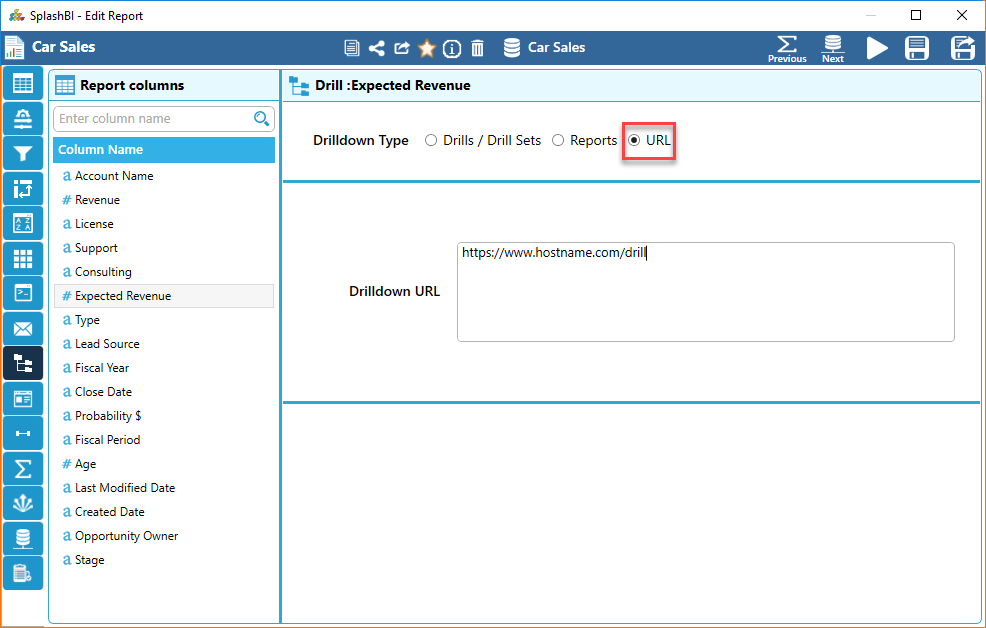
URL
Here URL can be edited or add a new report column and add URL for new DrillDown .
Report Template
The user can find the below screen for report templates.
Templates are used to generate the PDF and RTF outputs. The Templates can be edited in the screen below which will show the list of all the templates defined for a report.
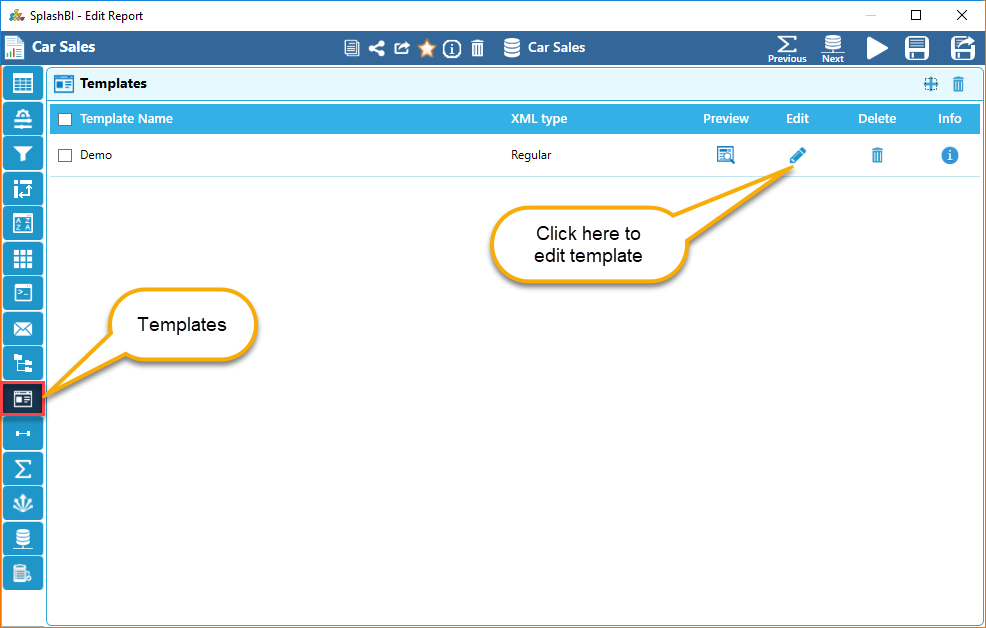
Template Name
Template name is the name of the Template to be created
Preview
Displays the uploaded template
Edit
This icon is used to edit the template
Info
The details of the temaplte can be seen by clicking on the info arrow.
Template Delete
Template can be deleted by clicking on the delete button.
Create Template
Template can be created by clicking on the Plus button. It navigates to a screen where in user can create a template as in the screen shot shown below.
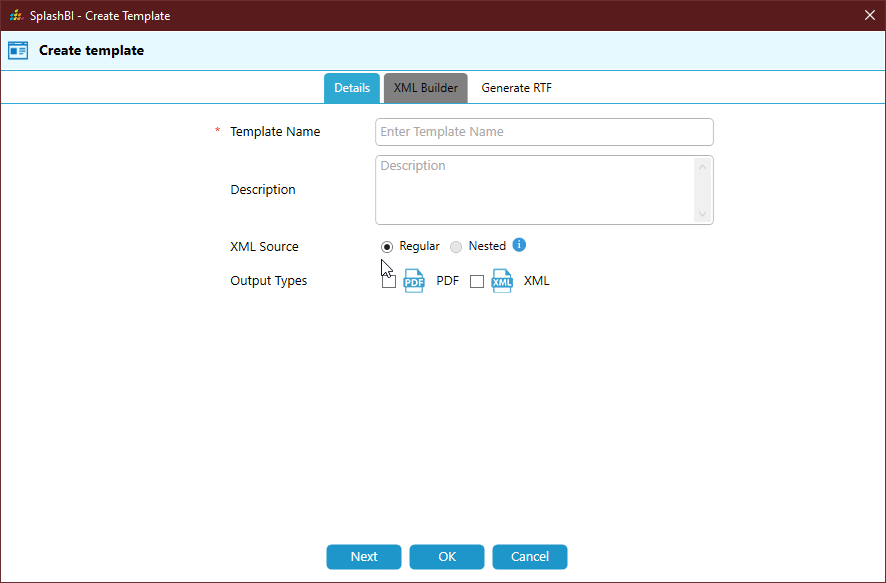
Template Name
Template name is the name of the Template to be created
Description
The description field defines the purpose of creating the template
XML Source
XML Source can be of 2 types.Regular & Nested.
Output Types
PDF,RTF and HTML are the template output types. PDF and RTF are selected by default when create the template.
Generate RTF
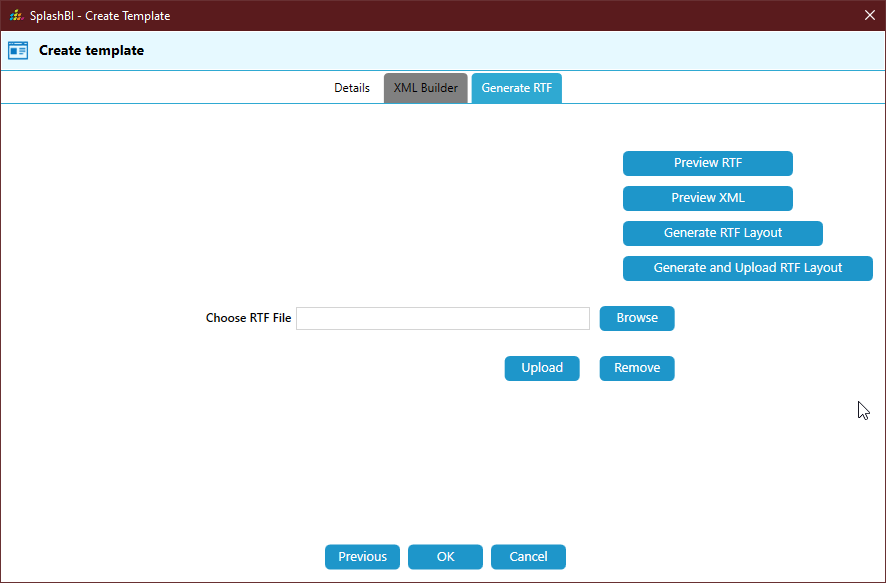
Generate RTF Layout
Generates RTF file based on the XML
Generate and Upload RTF Layout
Generates and Uploads the RTF Layout.
Preview RTF
This button is used to preview the RTF
Preview XML
This button is used to preview the XML
Browse RTF
RTF file can be browsed from the selected path and can be upload.
Remove
By clicking on the remove button the uploaded file can be removed.
Portals
The user can add or edit the portals in the below screen.
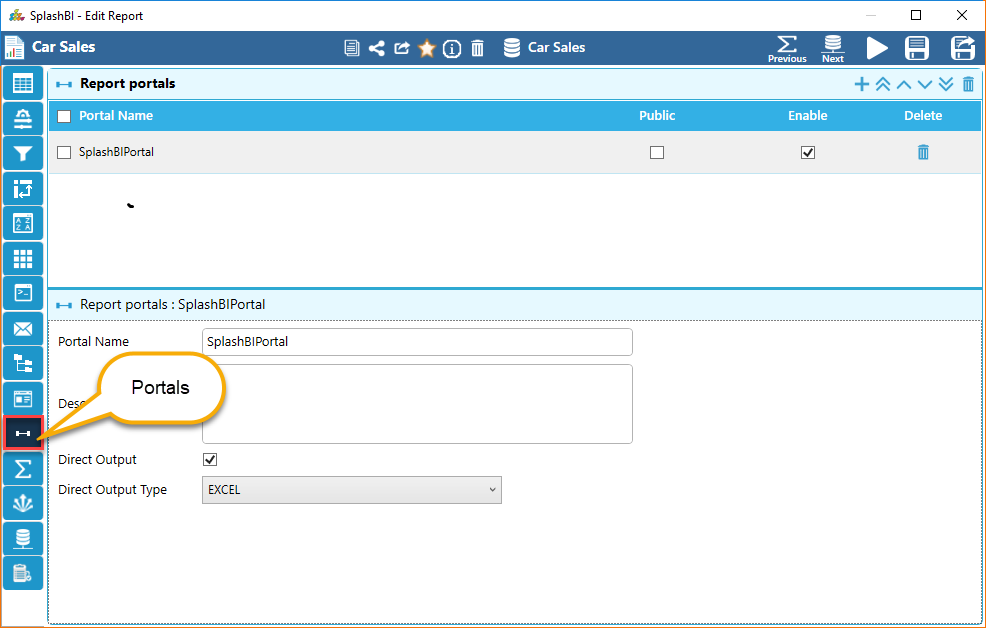
Portal Name
Provide unique portal name
Description
Provide details about the portal
Direct Output
By selecting the checkbox of the direct output , we get the output types option.
Direct Output Types
There are 6 output types provided.
Responsibilities
User can select the responsibilities from the dropdown for that portal.
URL
A URL is generated automatically which can be copied by clicking on the copy icon beside the URL textbox.
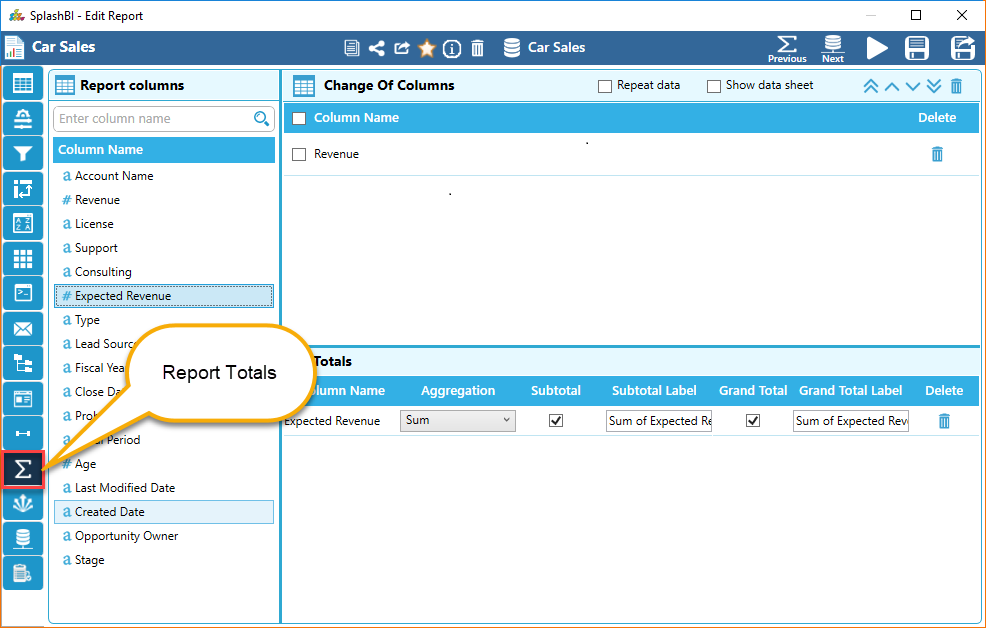
Totals
Totals tab is useful to show sub totals/aggregations on report columns in excel output data sheet rather than grouping the data in Pivot Excel output. "Totals" sheet will be displayed in Excel output where sub totals/aggregations are displayed as part of the data itself.
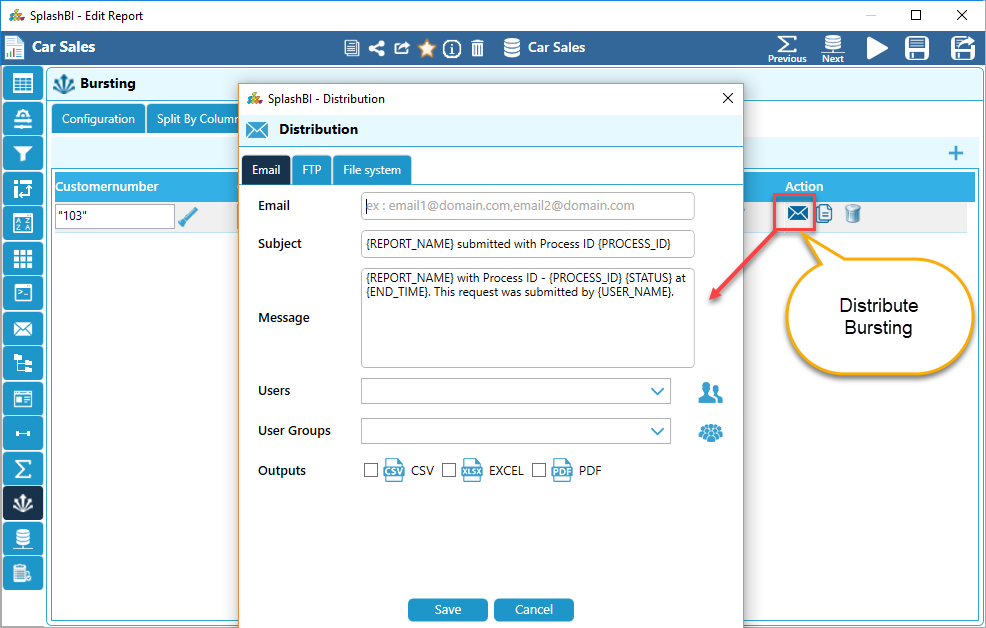
Bursting
Bursting tab is useful to burst report and configure bursting details as the process of running a report once and then dividing the results for recipients who each view a subset of the data.
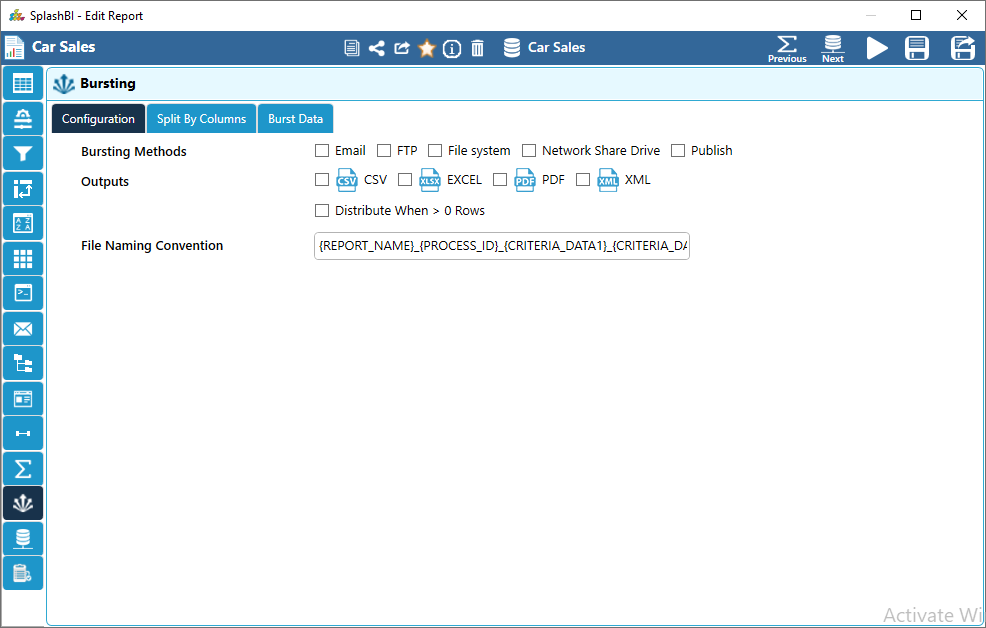
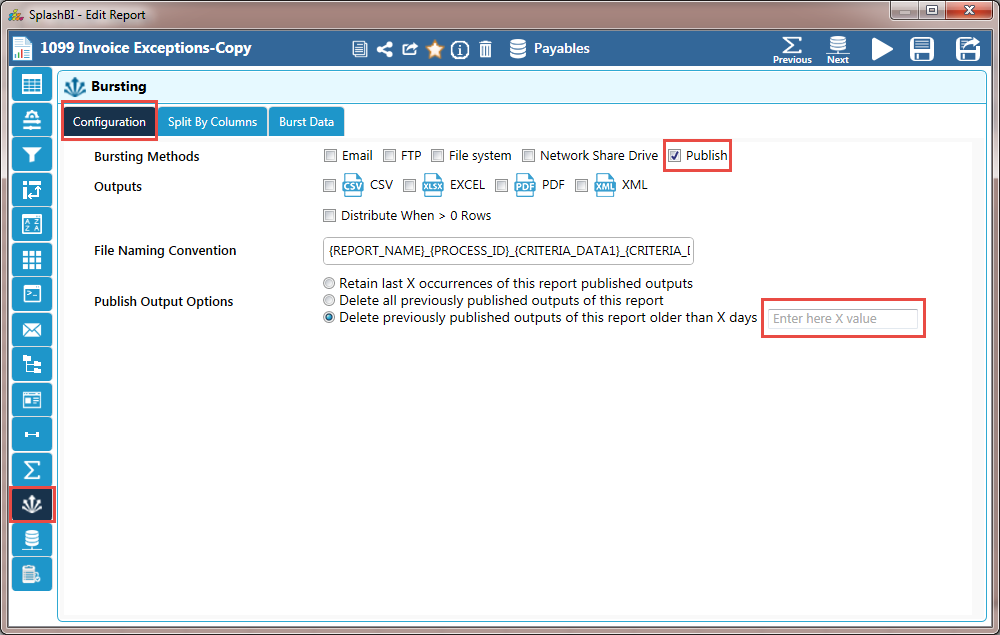
Configuration
In Configuration tab, user input values like the way bursting data reaches the intended user, i.e., via Email, File Transfer Protocol, File System and Network Share Drive. Check the option you wish to send the data through
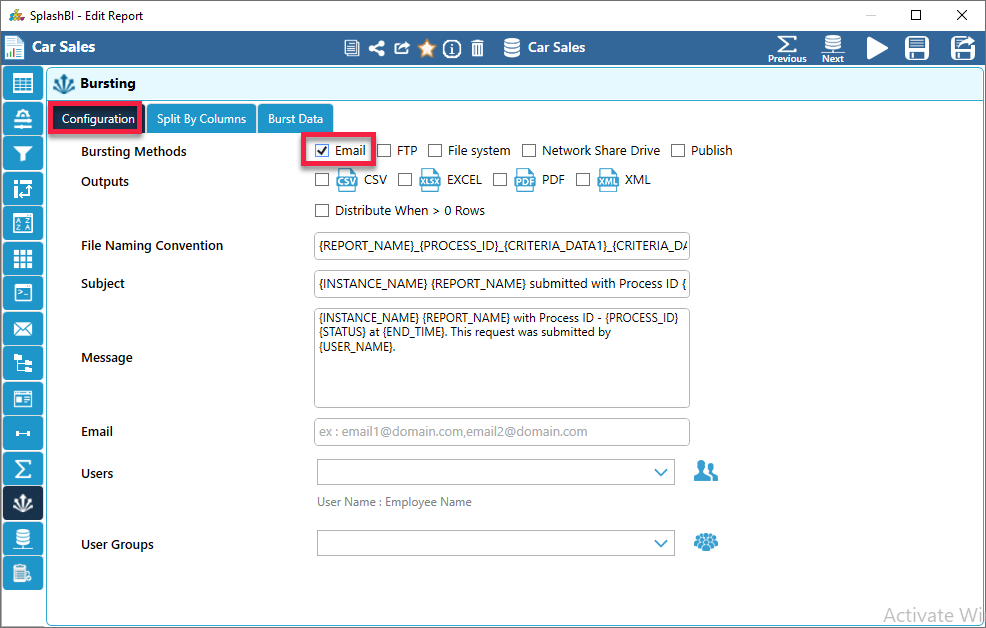
Checking Email will send the burst output via Email.
Enter subject that the end user will see when they receive the email in the Default Email Subject text box.
Enter the text the user will see when they receive the email in the Default Email Body text box.
You can use below enclosed codes in the email subject and body fields which will replaced dynamically in the process.
a. {REPORT_NAME}
b. {PROCESS_ID}
c. {TIMESTAMP}
Enter the emails of users that will receive the burst values.
If there are any user’s/user groups that contain emails enter them.
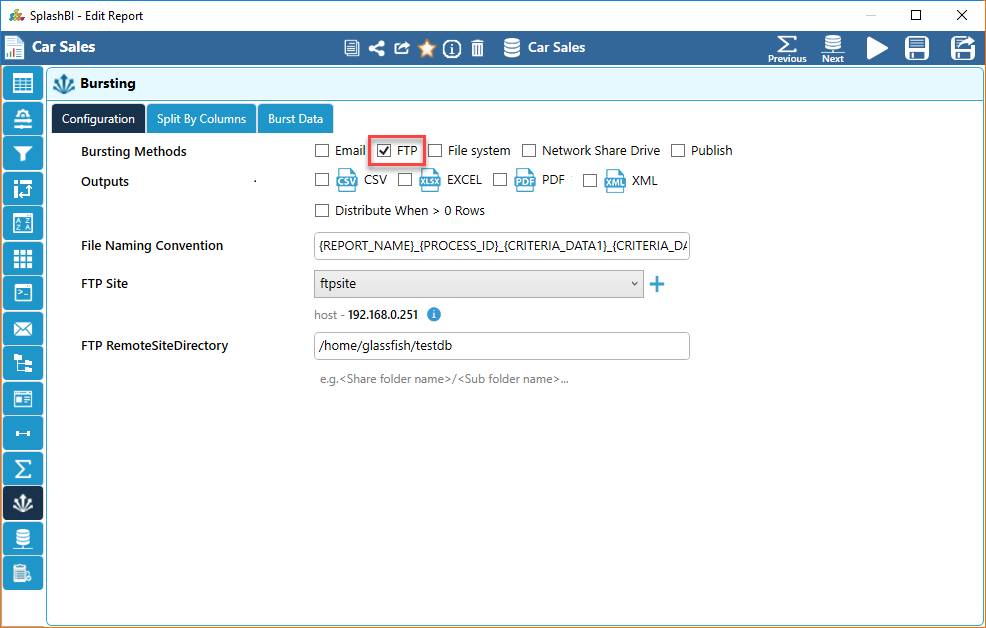
Checking FTP will send the burst output via FTP.
Provide FTP details and it will send the burst output via FTP.
Checking File System will send the burst output via File System.
Provide File System URL and it will send the burst output via File System.
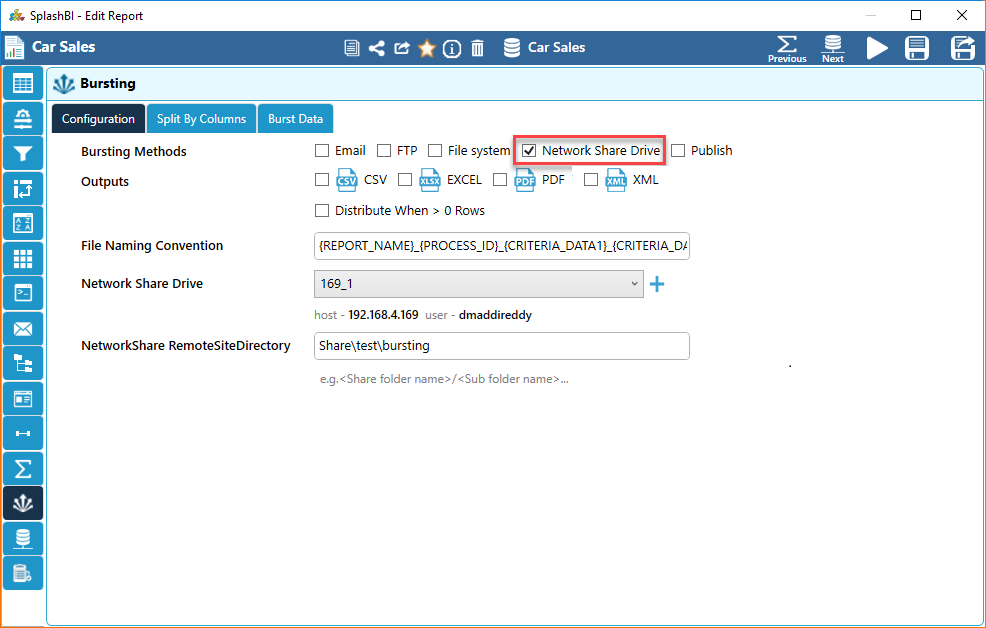
Checking Network Share System will send the burst output via Network Share Drive.
Provide Network Share drive path URL and it will send the burst output via Network Share Drive.
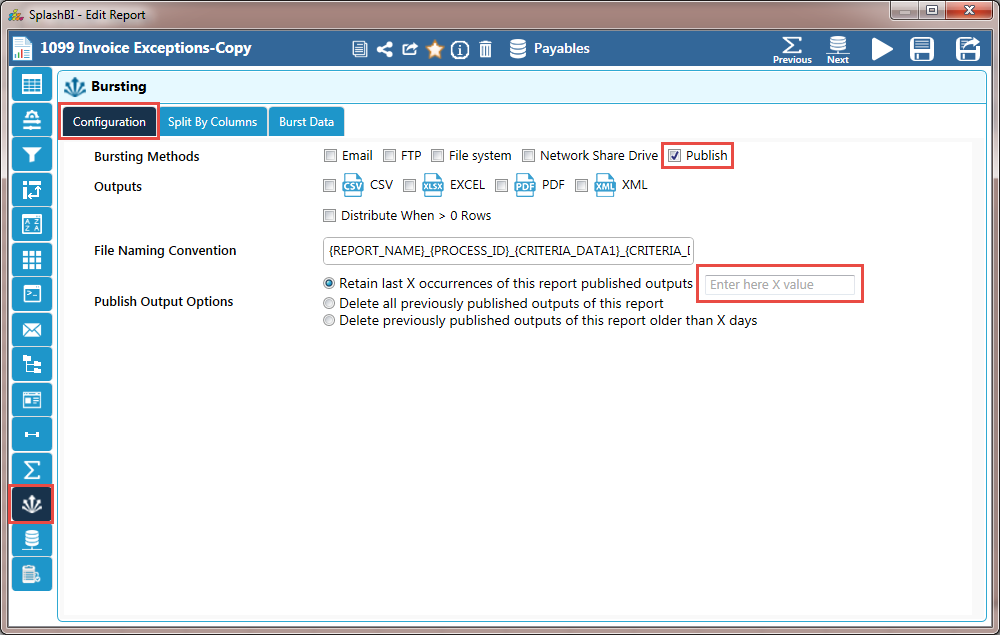
Publishing
Publishing is a process in which burst reports are published in the SplashBI application and the admin has the rights to control the quantity of the burst reports. Publishing reports helps to burst multiple reports to a user instead of sending then through Email, FTP or Network Share Drive.
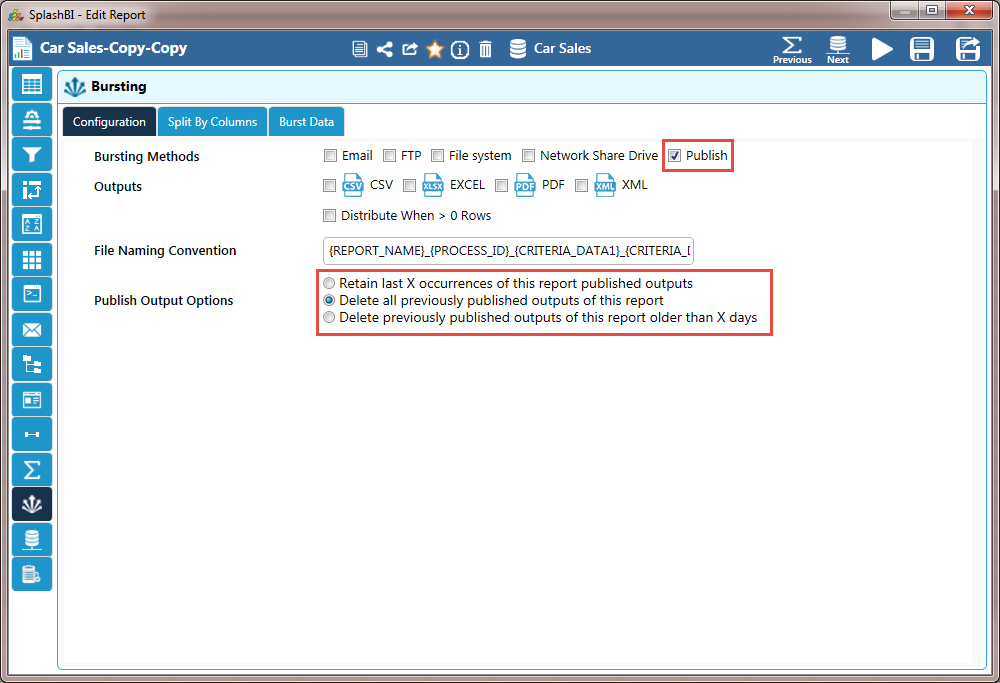
• Retain last X occurrences of this report published outputs
• Delete all previously published outputs of this report
• Delete previously outputs of this report older than X days
• None
Here X is a number database that can be set. Clicking the 1st and 3rd options will display a text box to enter the number.
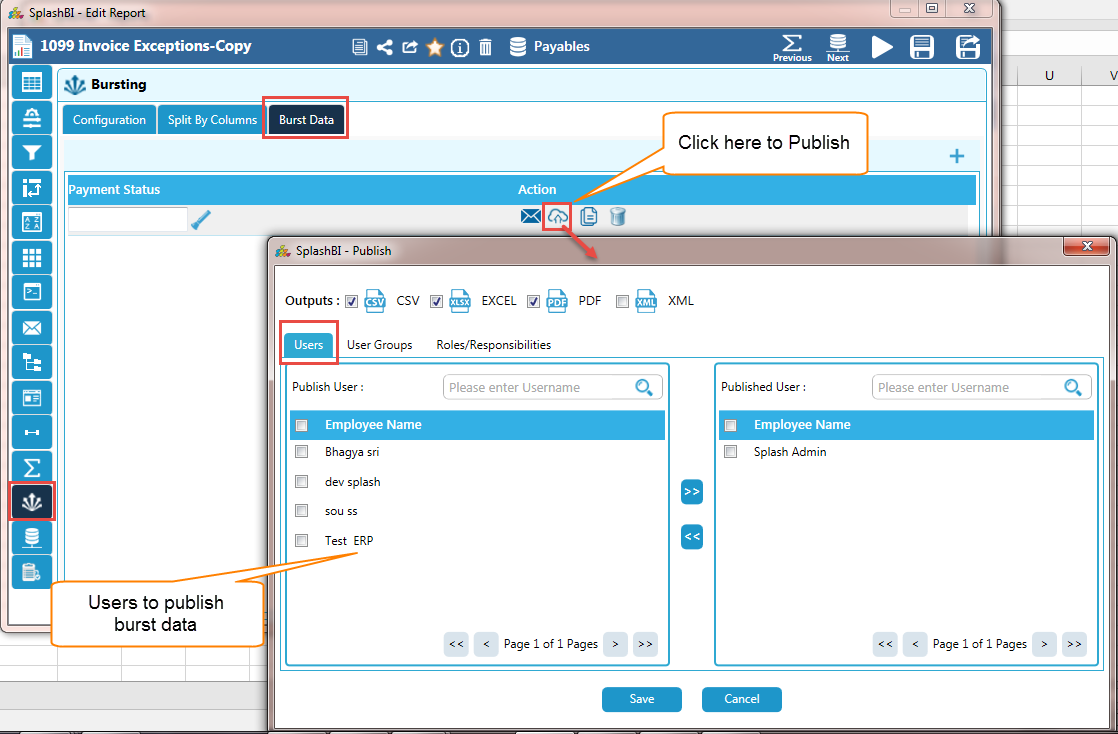
Click the Burst Data tab to publish the burst reports to the users with publish access.
Click the publish icon
In the following image select the users from the Publish Users panel and move them to the Published User panel using the arrows.
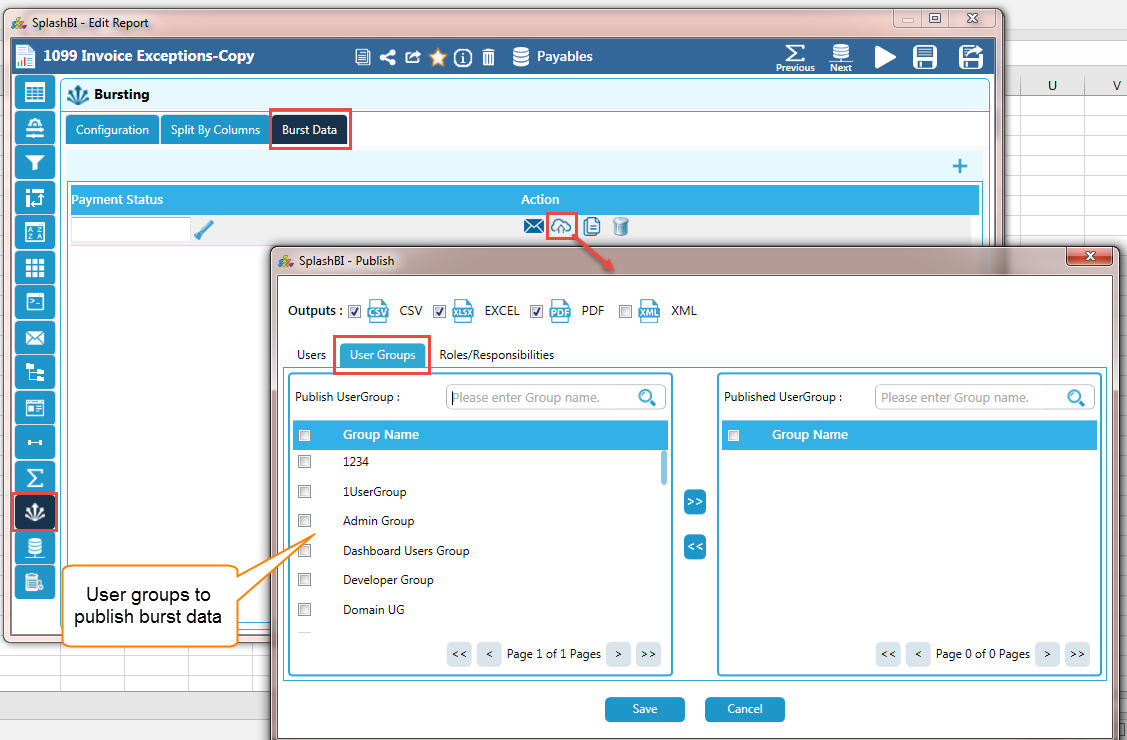
Click the Burst Data tab to publish the burst reports to the user groups with publish access.
Click the publish icon
In the following image select the user groups from the Publish User Groups panel and move them to the Published User Group panel using the arrows.
The published user, when logged in will be able to view, download, search and delete the burst reports. They can also refresh the page for new burst reports published. Apart from these action they do not access to anything else.
NOTE: The admin can create users exclusively for receiving published burst reports through the user creation functionality and checking the Publish option.
Split By Columns
You can choose the columns from which the values can be retrieved. By this process you filter columns.
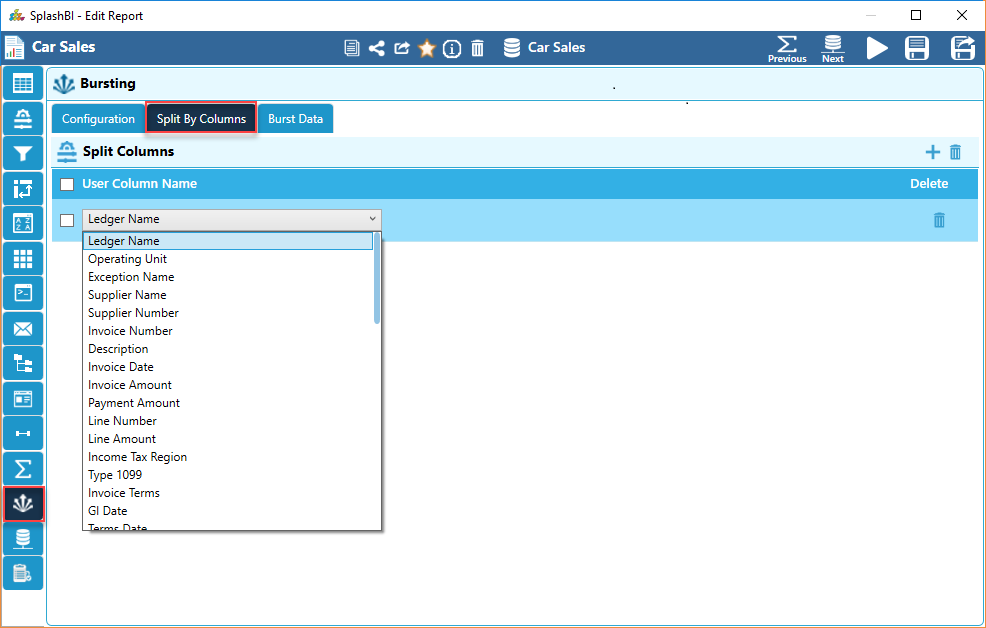
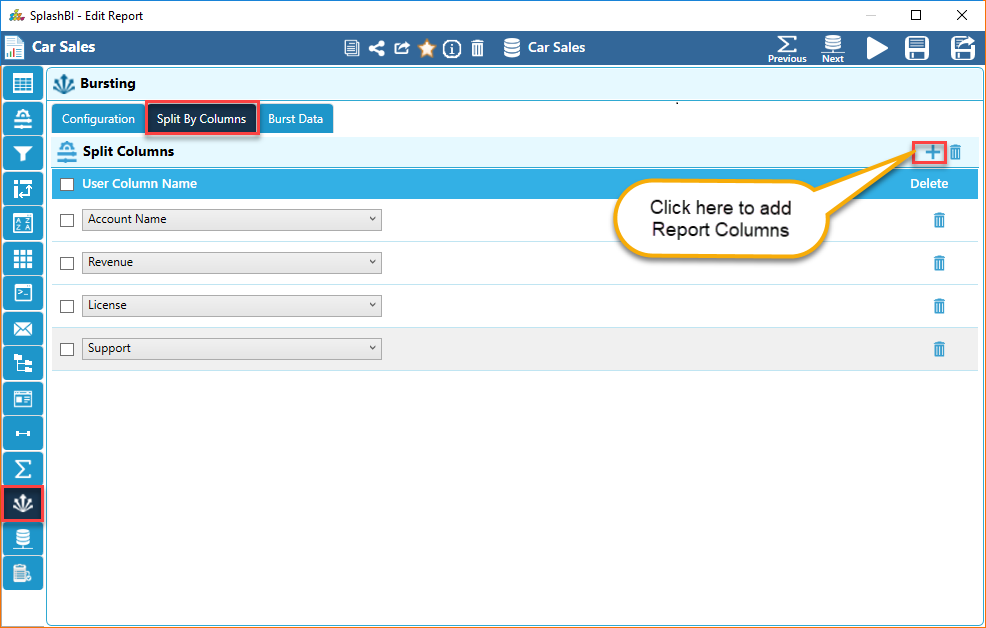
Click the plus sign to add a new column. Use the drop down to select the columns.
Click the bin icon to delete the column.
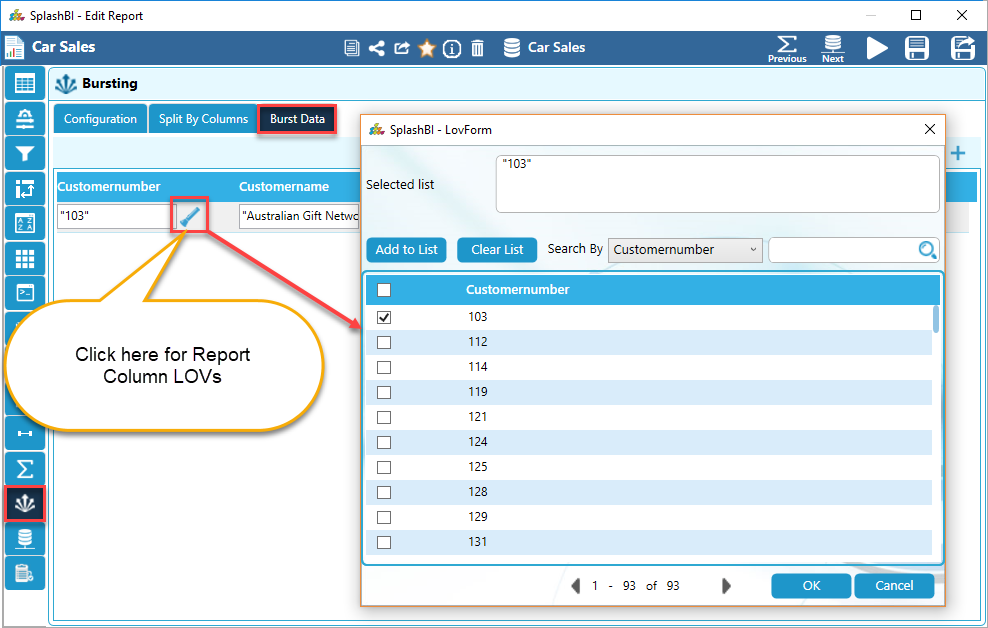
Burst Data
The Burst Data tab enables you to further filter down values. You can choose values from the columns that you have chosen in the previous tab. Once you save and run the report through bursting, then the filters given in this tab will be taken in to consideration during bursting process execution and output will be sent accordingly.
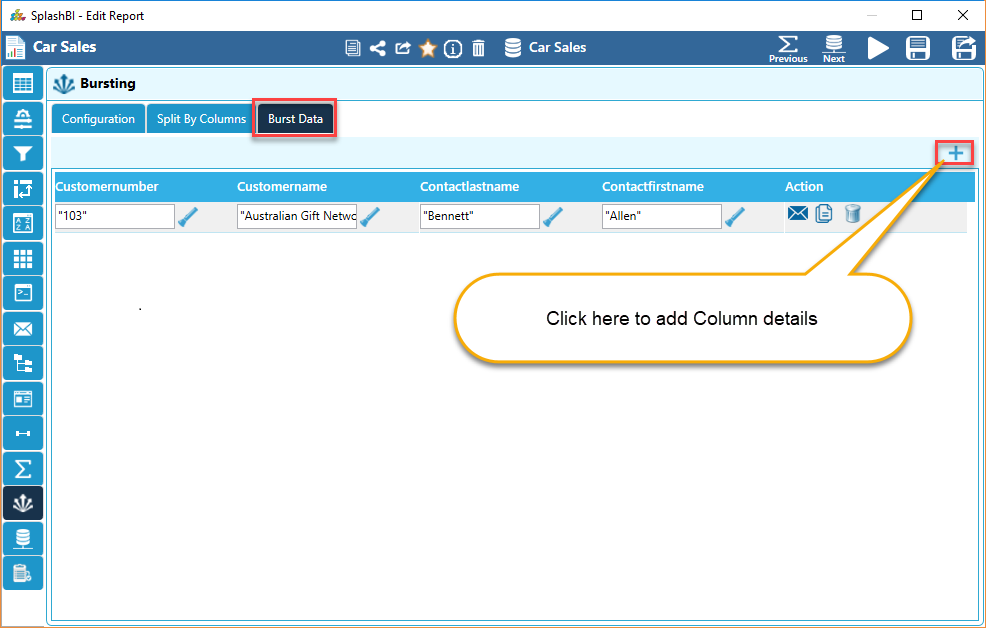
You can add a new burst data by adding the plus icon.
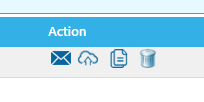
You can check/edit the bursting methods data by clicking the  icon
icon
Click the  icon to publish the burst output. For more information, see Publishing.
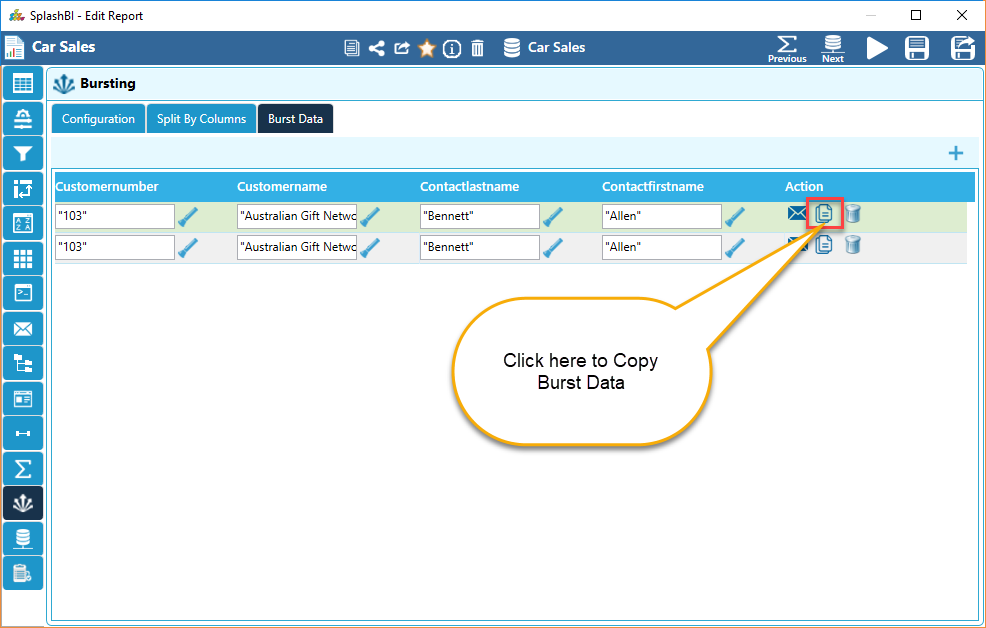
Click the corresponding icons to view options like Copy and Delete.
By criteria also user can burst for different users, user groups, ftp, file system. Otherwise default from configuration tab are considered. The burst data criteria distribution details will be loaded by default from configuration tab during initial creation but later on whatever saved once in criteria row will be considered. If a new record is added, then default will be loaded from configuration tab.
Click the  icon to search for entries within a selected column, as shown in the below image.
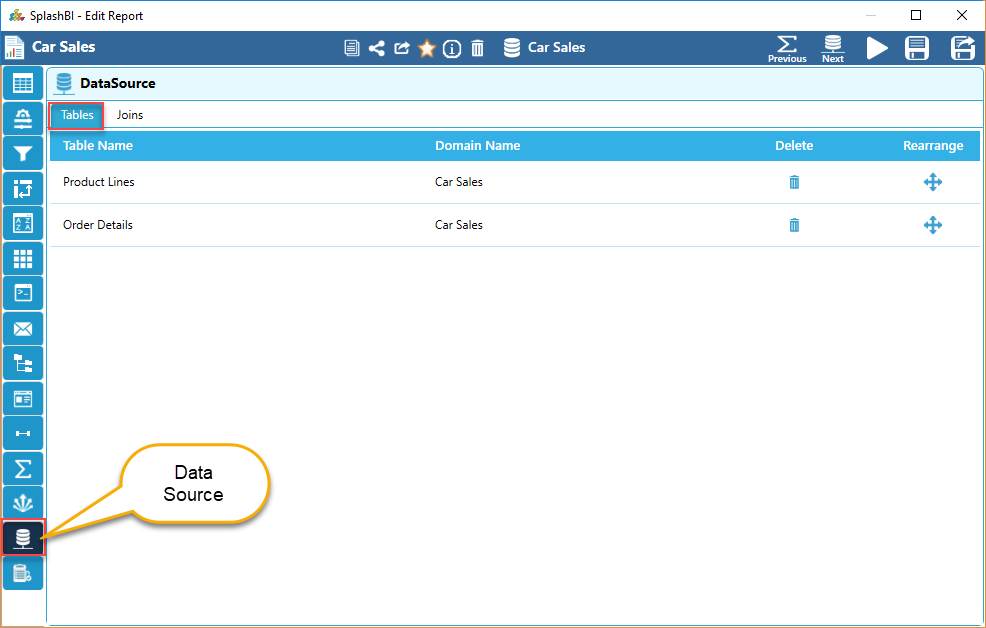
Data Source
The user can find the below screen for report data source.
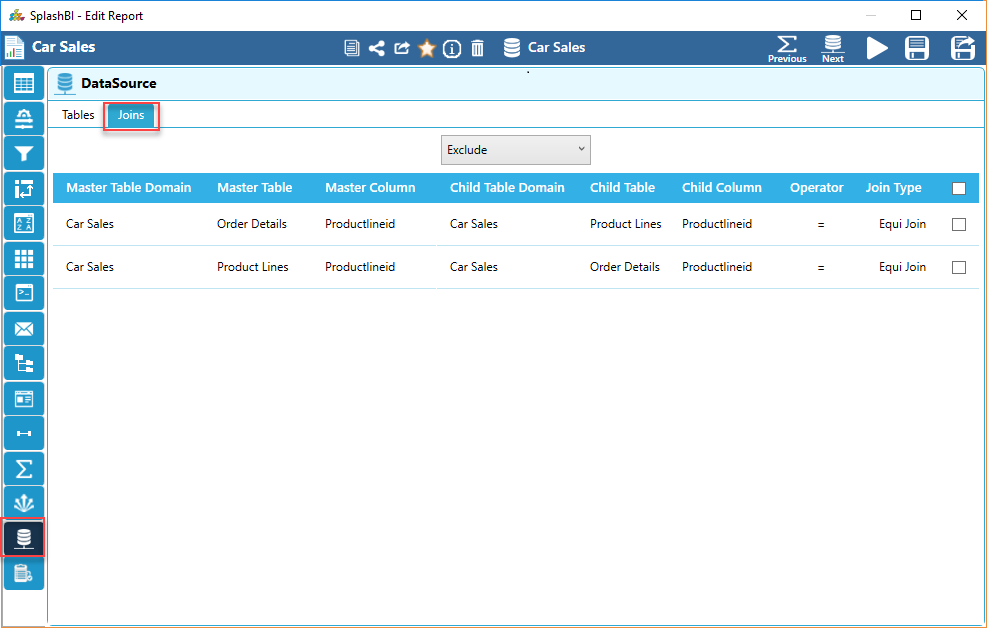
Joins
Joins is to create joins for the objects to add more columns to the report which is built on the report.Below screen shot displays list of objects used to join with that main object.
By clicking on the next tab the user is redirected to the Report Save tab.
Save Report
The user can find the below screen for save the changes in the report.
The user can edit MAX allowed rows and MAX allowed time in the below screen and can save the report.
Save & Run Report
The user can save the changes and run the report directly from the current tab by clicking on the save & run button in all the screens .
Save & Close Report
The user can save the changes by clicking on the save & close button in all the screens .